Joins plots together
create.multipanelplot.RdMerges together multiple plots in the specified layout
Usage
create.multipanelplot(
  plot.objects = NULL,
  filename = NULL,
  height = 10,
  width = 10,
  resolution = 1000,
  plot.objects.heights = c(rep(1,layout.height)),
  plot.objects.widths = c(rep(1,layout.width)),
  layout.width = 1,
  layout.height = length(plot.objects),
  main = '',
  main.x = 0.5,
  main.y = 0.5,
  x.spacing = 0,
  y.spacing = 0,
  xlab.label = '',
  xlab.cex = 2,
  ylab.label = '',
  ylab.label.right = '',
  ylab.cex = 2,
  main.cex = 3,
  legend = NULL,
  left.padding = 0,
  ylab.axis.padding = c(rep(0, layout.width)),
  xlab.axis.padding = c(rep(0, layout.height)),
  bottom.padding = 0,
  top.padding = 0,
  right.padding = 0,
  layout.skip = c(rep(FALSE, layout.width*layout.height)),
  left.legend.padding = 2,
  right.legend.padding = 2,
  bottom.legend.padding = 2,
  top.legend.padding = 2,
  description = 'Created with BoutrosLab.plotting.general',
  size.units = 'in',
  enable.warnings = FALSE,
  style = "BoutrosLab",
  use.legacy.settings = FALSE
);
Arguments
- plot.objects
A list of plot objects. Goes in this order: Top Left, Top Right, Bottom Left, Bottom Right
- filename
Filename to output to
- height
Height of resulting file
- width
Width of resulting file
- resolution
Resolution of resulting file
- plot.objects.heights
Heights of each row of the plot. Must be vector of same size as layout.height
- plot.objects.widths
Widths of each column of the plot. Must be vector of same size as layout.width
- layout.width
how many plots per row.
- layout.height
how many plots per column
- main
main label text
- main.x
main label x coordinate
- main.y
main label y coordinate
- x.spacing
horizontal spacing between each plot. Can be single value or vector of length layout.width - 1
- y.spacing
vertical spacing between each plot. Can be single value or vector of length layout.height - 1
- xlab.label
bottom x-axis main label
- xlab.cex
bottom x-axis main label cex
- ylab.label
left side y-axis label
- ylab.label.right
right side y-axis label
- ylab.cex
y-axis label cex
- main.cex
main label cex
- legend
legend for the plot
- left.padding
padding from the left side of the frame
- ylab.axis.padding
padding between axis and y label of plots. Can be single value or vector of length layout.width
- xlab.axis.padding
padding between axis and x label of plots. Can be single value or vector of length layout.height
- bottom.padding
padding from the bottom side of the frame
- top.padding
padding from the top side of the frame
- right.padding
padding from the right side of the frame
- layout.skip
list specifiying locations to skip plots. Must be vector of length layout.width*layout.height
- left.legend.padding
padding between legend and left side of figure (can use without a legend)
- right.legend.padding
padding between legend and right side of figure (can use without a legend)
- bottom.legend.padding
padding between legend and bottom side of figure (can use without a legend)
- top.legend.padding
padding between legend and top side of figure (can use without a legend)
- description
description of what plot is displaying
- size.units
the units the height and width of file represent
- enable.warnings
enables warnings to be output
- style
defaults to “BoutrosLab”, also accepts “Nature”, which changes parameters according to Nature formatting requirements
- use.legacy.settings
boolean to set wheter or not to use legacy mode settings (font)
Warning
If this function is called without capturing the return value, or specifying a filename, it may crash while trying to draw the histogram. In particular, if a script that uses such a call of create histogram is called by reading the script in from the command line, it will fail badly, with an error message about unavailable fonts:
    Error in grid.Call.graphics("L_text", as.graphicsAnnot(x$label), x$x,  )
        Invalid font type
    Calls: print ... drawDetails.text -> grid.Call.graphics -> .Call.graphics
Examples
set.seed(12345);
# begin by creating the individual plots which will be combined into a multiplot
dist <- data.frame(
a = rnorm(100, 1),
b = rnorm(100, 3),
c = rnorm(100, 5)
);
simple.data <- data.frame(
x = c(dist$a, dist$b, dist$c),
y = rep(LETTERS[1:3], each = 100)
);
fill.squares <- matrix(c(1, 0, 0, 0, 1, 0, 0, 0, 1), ncol = 3, byrow = TRUE);
rownames(fill.squares) <- c("Drug I only", "Drug II only" , "Drugs I & II");
colnames(fill.squares) <- levels(factor(simple.data$y));
# Create plot # 1
simple.boxplot <- create.boxplot(
formula = x ~ y,
data = simple.data,
xaxis.lab = c('','',''),
main.x = 0.57,
ylab.label = 'Sugar Level',
xlab.label = '',
col = 'lightgrey',
xaxis.tck = c(0,0),
yaxis.tck = c(1,0),
yaxis.lab = seq(-1,8,2) ,
yat = seq(-1,8,2),
left.padding = 0,
right.padding = 0,
lwd = 2
);
# Create plot # 2
simple.heatmap <- create.heatmap(
x = t(fill.squares),
clustering.method = 'none',
shrink = 0.8,
yaxis.lab = c(3,2,3),
yaxis.tck = 1,
xaxis.lab = c('A','B','C'),
ylab.label = 'Drug Regimen',
xlab.label = 'Patient Group',
colour.scheme = c("white", "grey20"),
fill.colour = "white",
print.colour.key = FALSE,
left.padding = 0,
xaxis.tck = c(1,0),
right.padding = 0,
xaxis.rot = 0
);
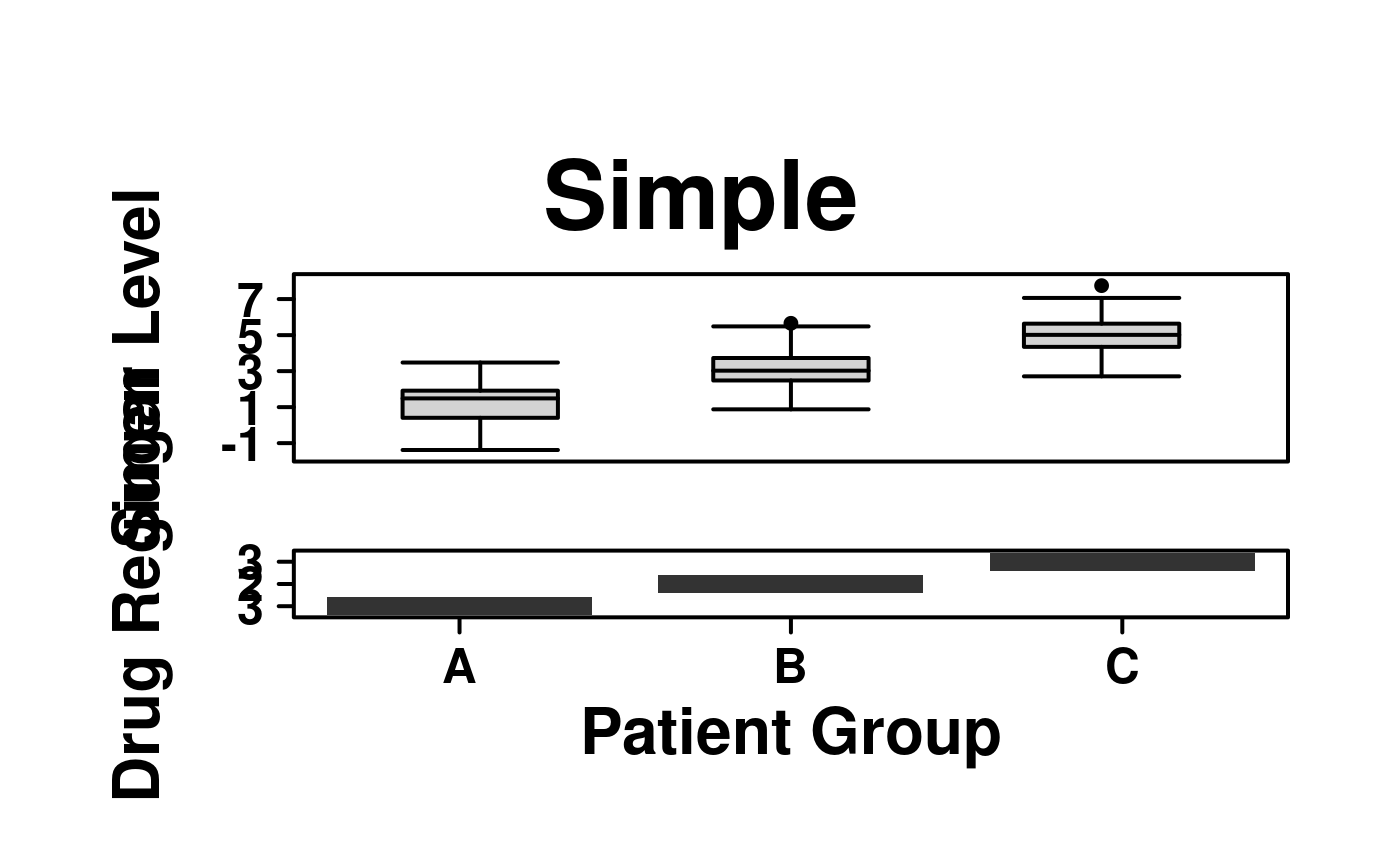
create.multipanelplot(
# filename = tempfile(pattern = 'Multipanelplot_Simple', fileext = '.tiff'),
plot.objects = list(simple.boxplot,simple.heatmap),
y.spacing = 1,
ylab.axis.padding = 2,
main = 'Simple',
top.padding = 2,
resolution = 200
);
 # Create plot # 2
simple.heatmap.with.legends <- create.heatmap(
x = t(fill.squares),
shrink = 0.8,
yaxis.lab = c(3,2,3),
yaxis.tck = 1,
xaxis.lab = c('A','B','C'),
ylab.label = 'Drug Regimen',
xlab.label = '',
colour.scheme = c("white", "grey20"),
fill.colour = "white",
left.padding = 0,
xaxis.tck = c(1,0),
right.padding = 0,
xaxis.rot = 0
);
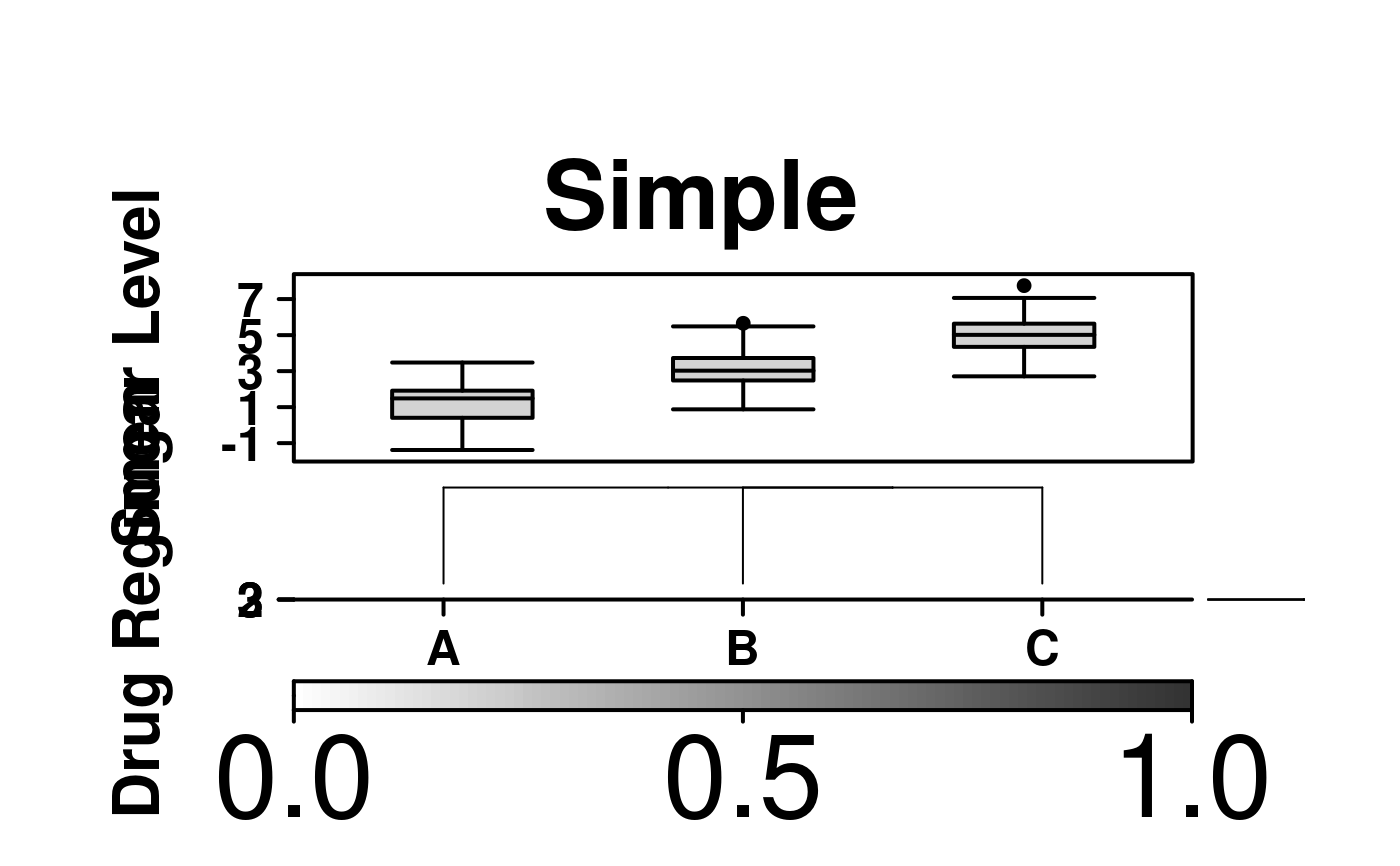
create.multipanelplot(
# filename = tempfile(pattern = 'Multipanelplot_Simple_Legends', fileext = '.tiff'),
plot.objects = list(simple.boxplot,simple.heatmap.with.legends),
y.spacing = 1,
ylab.axis.padding = 2,
main = 'Simple',
top.padding = 2,
resolution = 200
);
 # \donttest{
# Create plot # 1
simple.boxplot2 <- create.boxplot(
formula = x ~ y,
data = simple.data,
ylab.label = 'Sugar Level',
xlab.label = '',
col = 'lightgrey',
xaxis.tck = c(0,0),
xaxis.lab = c('','',''),
yaxis.tck = c(1,0),
yaxis.lab = seq(-1,8,2),
yat = seq(-1,8,2),
left.padding = 0,
right.padding = 0,
lwd = 2
);
simple.violin2 <- create.violinplot(
formula = x ~ y,
data = simple.data,
col = 'lightgrey',
yaxis.tck = c(0,0),
xlab.label = '',
ylab.label = '',
yaxis.lab = NULL,
xaxis.lab = c('','',''),
xaxis.tck = c(0,0)
);
# Create plot # 2
simple.heatmap2 <- create.heatmap(
x = t(fill.squares),
clustering.method = 'none',
shrink = 0.8,
yaxis.lab = c(1,2,3),
yaxis.tck = 1,
xaxis.lab = c('A','B','C'),
ylab.label = 'Drug Regimen',
colour.scheme = c("white", "grey20"),
fill.colour = "white",
print.colour.key = FALSE,
left.padding = 0,
xaxis.tck = c(3,0),
right.padding = 0,
xaxis.rot = 0,
ylab.cex = 2
);
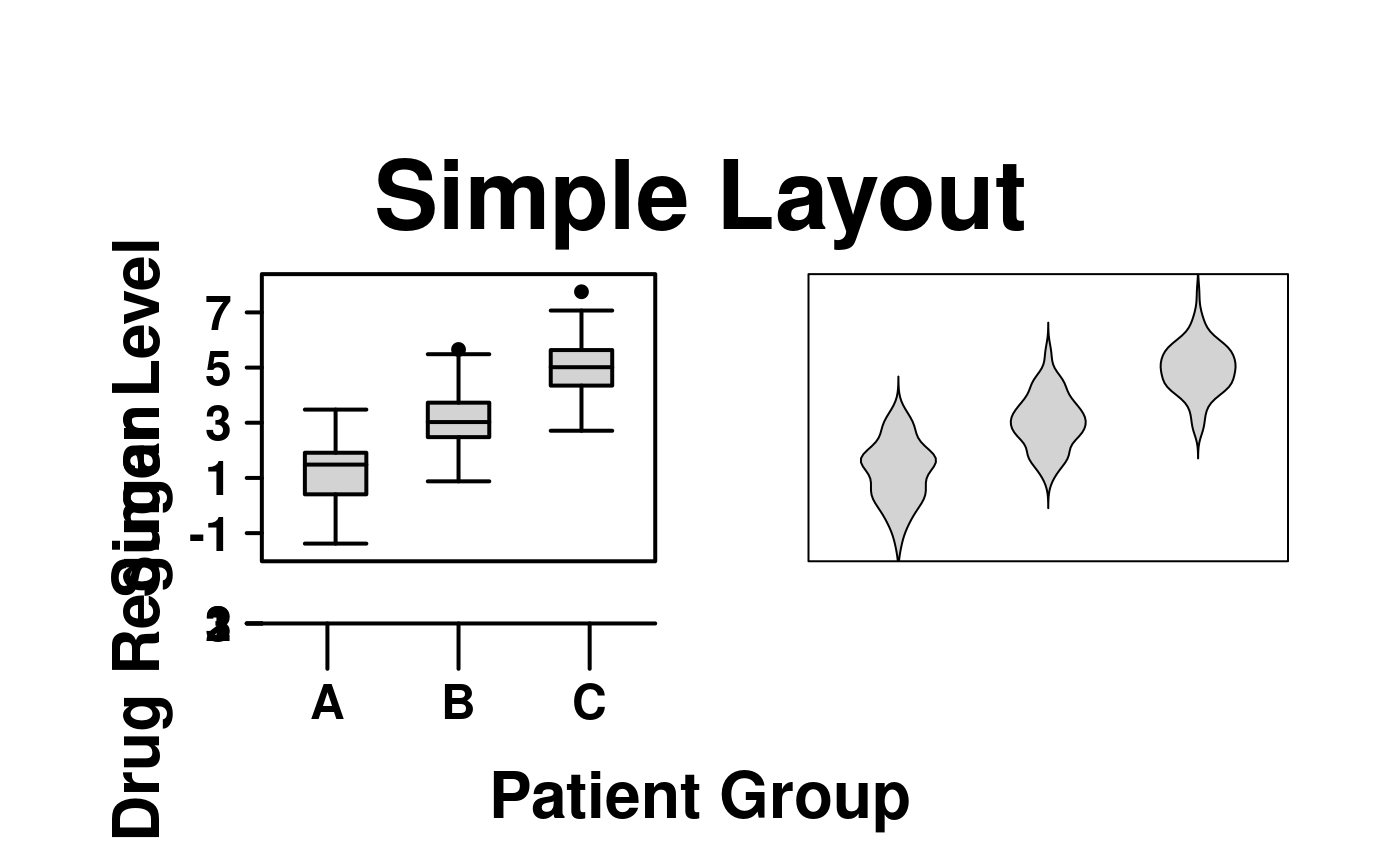
create.multipanelplot(
# filename = tempfile(pattern = 'Multipanelplot_Simple_Layout', fileext = '.tiff'),
plot.objects = list(simple.boxplot2,
simple.violin2,simple.heatmap2),
layout.width = 2,
layout.height = 2,
xlab.label = 'Patient Group',
main = 'Simple Layout',
top.padding = 2,
plot.objects.heights = c(3,1),
x.spacing = 1,
y.spacing = 1
);
 all.data <- data.frame(
a = rnorm(n = 25, mean = 0, sd = 0.75),
b = rnorm(n = 25, mean = 0, sd = 0.75),
c = rnorm(n = 25, mean = 0, sd = 0.75),
d = rnorm(n = 25, mean = 0, sd = 0.75),
e = rnorm(n = 25, mean = 0, sd = 0.75),
f = rnorm(n = 25, mean = 0, sd = 0.75),
x = rnorm(n = 25, mean = 5),
y = seq(1, 25, 1)
);
# create the plot -- this allows for previewing of the individual plot
barplot.formatted <- create.barplot(
formula = x ~ y,
data = all.data[,7:8],
yaxis.tck = c(1,0),
border.lwd = 0,
col = 'grey',
xlab.label = '',
xat = c(-100),
ylab.label = '',
yaxis.lab = seq(1, ceiling(max(all.data$x)), 1),
yat = seq(1, ceiling(max(all.data$x)), 1),
yaxis.cex = 1.5
);
heatmap.formatted <- create.heatmap(
x = all.data[,1:6],
clustering.method = 'none',
colour.scheme = c('magenta','white','green'),
print.colour.key = FALSE,
xlab.label = '',
yaxis.tck = c(1,0),
xaxis.tck = c(1,0),
xat = c(1:25),
yaxis.lab = c("BRCA1", "BRCA2", "APC", "TIN", "ARG", "FOO"),
yat = c(1,2,3,4,5,6),
xaxis.lab = c(1:25),
xaxis.rot = 0,
yaxis.cex = 1.5
);
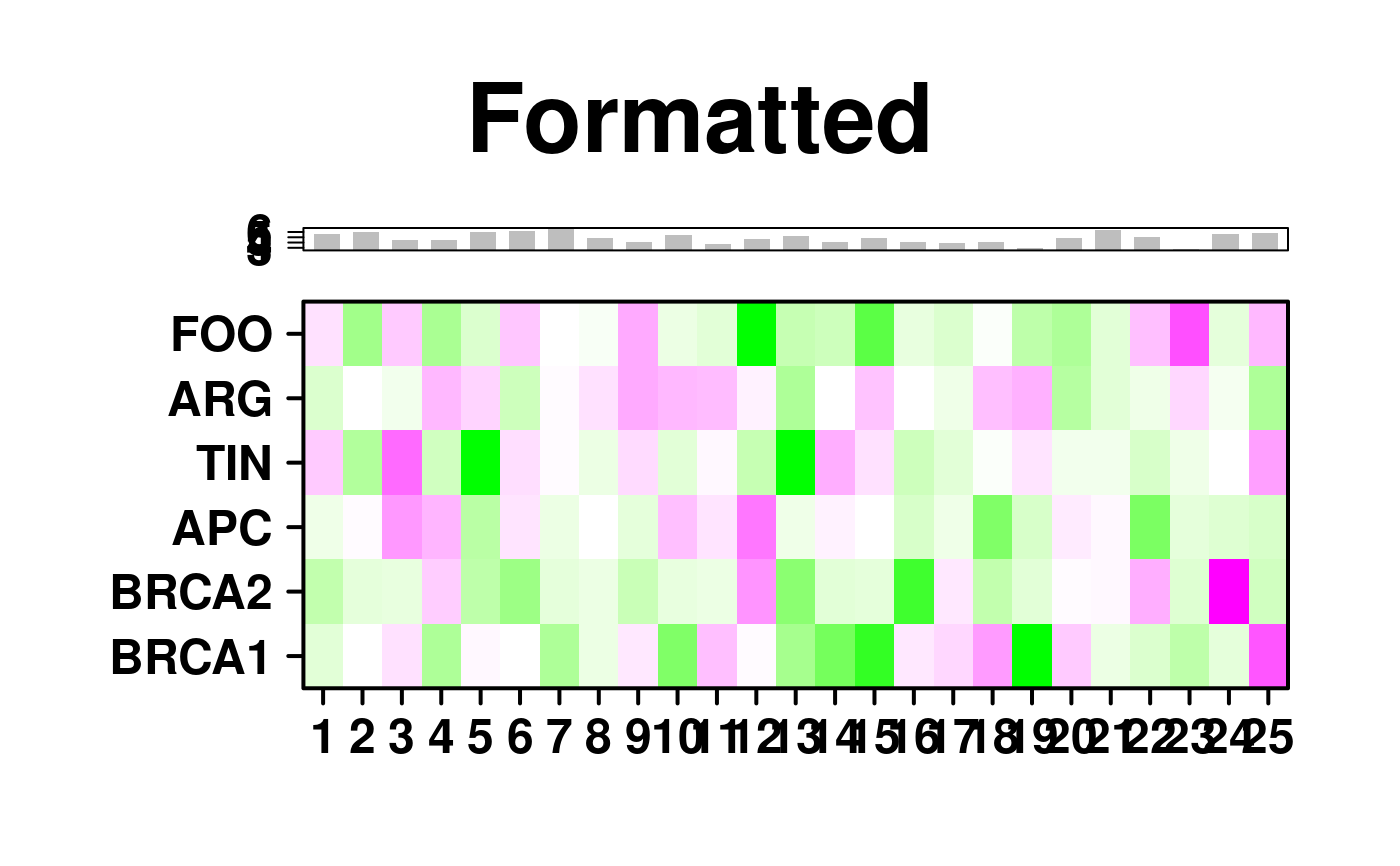
create.multipanelplot(
# filename = tempfile(pattern = 'Multipanelplot_formatted', fileext = '.tiff'),
plot.objects = list(barplot.formatted, heatmap.formatted),
plot.objects.heights = c(1,3),
y.spacing = -3.75,
main = 'Formatted',
top.padding = 0
);
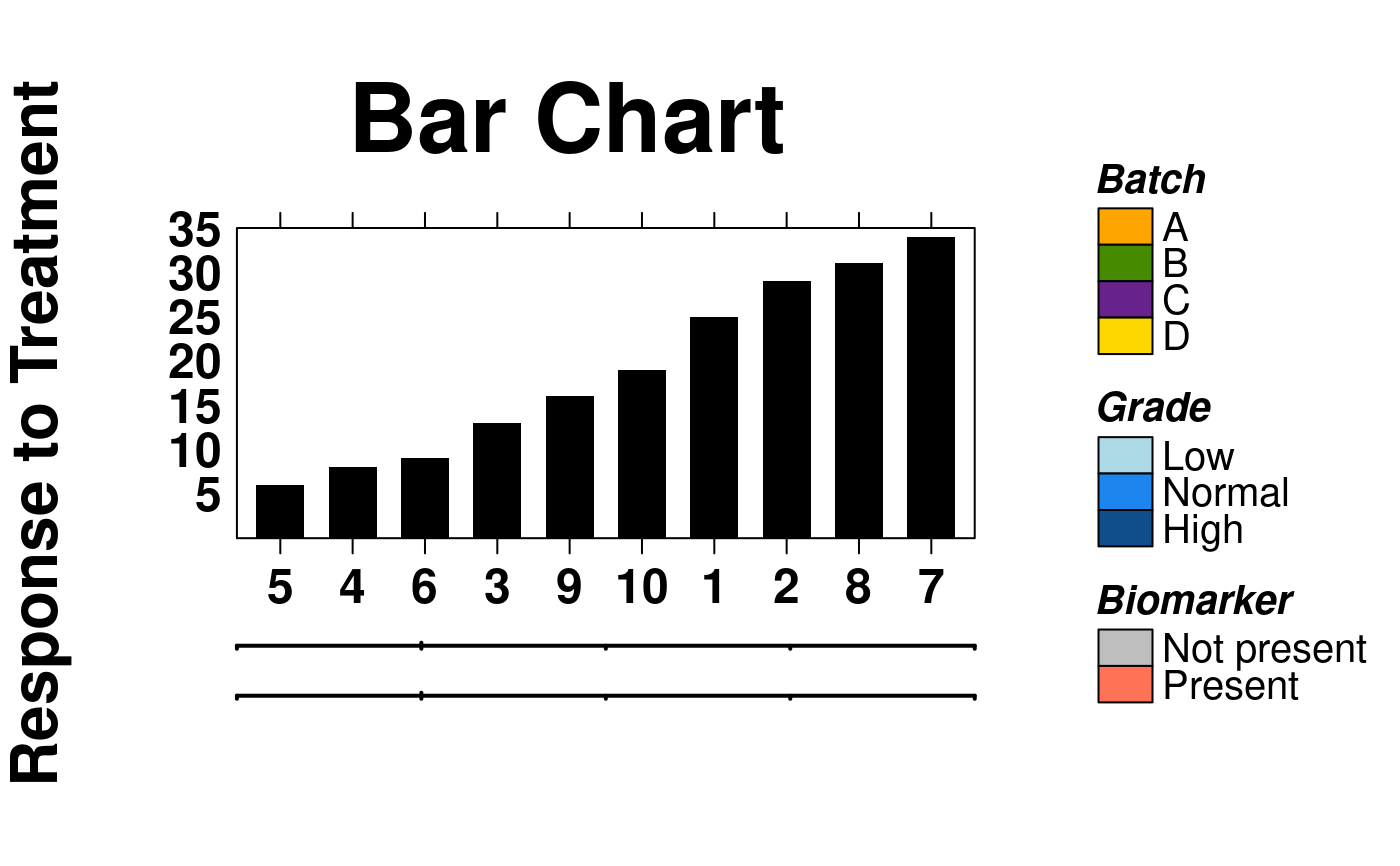
 data.bars <- data.frame(
x = sample(x = 5:35, size = 10),
y = seq(1,10,1)
);
data.cov <- data.frame(
x = rnorm(n = 10, mean = 0, sd = 0.75),
y = rnorm(n = 10, mean = 0, sd = 0.75),
z = rnorm(n = 10, mean = 0, sd = 0.75)
);
# Create main barplot
bars <- create.barplot(
formula = x~y,
data = data.bars,
ylimits = c(0,35),
ylab.label = '',
sample.order = 'increasing',
border.lwd = 0,
yaxis.lab = seq(5,35,5),
yat = seq(5,35,5),
yaxis.tck = c(0,0),
xlab.label = ''
);
# Make covariate bars out of heatmaps
cov.1 <- create.heatmap(
x = as.matrix(data.bars$y),
clustering.method = 'none',
scale.data = FALSE,
colour.scheme = default.colours(4),
grid.col = TRUE,
col.colour = 'black',
# col.lwd = 10,
total.col = 5,
print.colour.key = FALSE,
yaxis.tck = 0,
axes.lwd = 0
);
cov.2 <- create.heatmap(
x = as.matrix(data.cov$y),
clustering.method = 'none',
scale.data = FALSE,
colour.scheme = c("lightblue","dodgerblue2", "dodgerblue4"),
grid.col = TRUE,
col.colour = 'black',
# col.lwd = 10,
total.col = 4,
print.colour.key = FALSE,
yaxis.tck = 0
);
#> Warning: Colour allocation scheme failed, moving to a default method
cov.3 <- create.heatmap(
x = as.matrix(data.cov$z),
clustering.method = 'none',
scale.data = FALSE,
colour.scheme = c("grey","coral1"),
grid.col = TRUE,
col.colour = 'black',
# col.lwd = 10,
total.col = 3,
print.colour.key = FALSE,
yaxis.tck = 0
);
legendG <- legend.grob(
list(
legend = list(
colours = default.colours(4),
title = "Batch",
labels = LETTERS[1:4],
size = 3,
title.cex = 1,
label.cex = 1,
border = 'black'
),
legend = list(
colours = c("lightblue","dodgerblue2","dodgerblue4"),
title = "Grade",
labels = c("Low","Normal","High"),
size = 3,
title.cex = 1,
label.cex = 1,
border = 'black'
),
legend = list(
colours = c("grey","coral1"),
title = "Biomarker",
labels = c("Not present","Present"),
size = 3,
title.cex = 1,
label.cex = 1,
border = 'black'
)
),
label.cex = 1.25,
title.cex = 1.25,
title.just = 'left',
title.fontface = 'bold.italic',
size = 3,
layout = c(1,3)
);
create.multipanelplot(
# filename = tempfile(pattern = 'Multipanelplot_Barchart', fileext = '.tiff'),
plot.objects = list(bars, cov.3, cov.2, cov.1 ),
plot.objects.heights = c(1, 0.1,0.1,0.1),
legend = list(right = list(fun = legendG)),
ylab.label = 'Response to Treatment',
main = 'Bar Chart',
x.spacing = 0,
y.spacing = 0.1
);
 # Set up plots for complex example
# Dotmap
spot.sizes <- function(x) { 0.5 * abs(x); }
dotmap.dot.colours <- c('red','blue');
spot.colours <- function(x) {
colours <- rep('white', length(x));
colours[sign(x) == -1] <- dotmap.dot.colours[1];
colours[sign(x) == 1] <- dotmap.dot.colours[2];
return(colours);
};
# Dotmap colours
orange <- rgb(249/255, 179/255, 142/255);
blue <- rgb(154/255, 163/255, 242/255);
green <- rgb(177/255, 213/255, 181/255);
bg.colours <- c(green, orange, blue, 'gold', 'skyblue', 'plum');
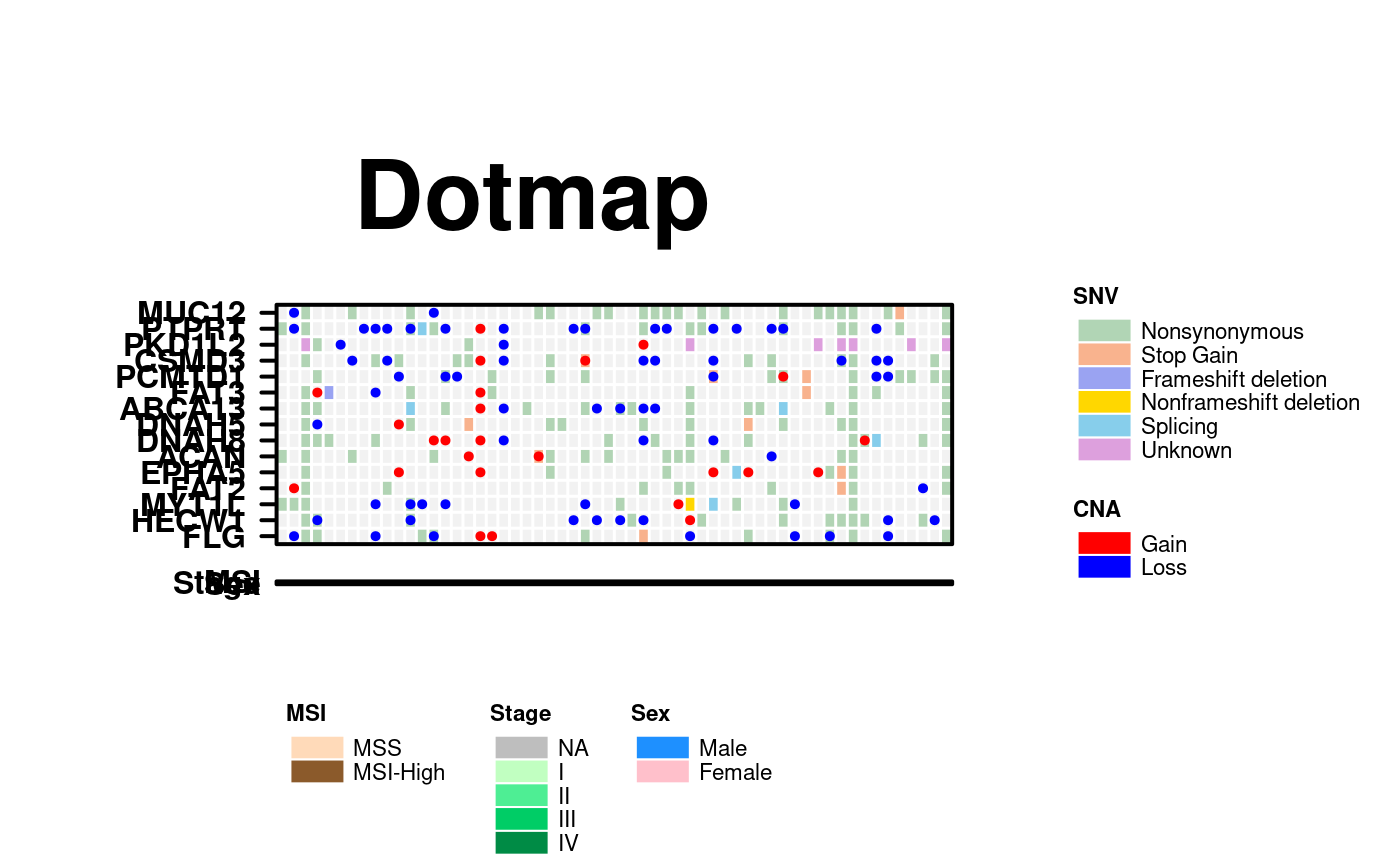
dotmap <- create.dotmap(
x = CNA[1:15,1:58],
bg.data = SNV[1:15,1:58],
# Set the colour scheme
colour.scheme = bg.colours,
# Set the breakpoints for the colour scheme (determined from the data)
at = c(0,1,2,4,6,7,8),
# Specify the total number of colours (+1 for the fill colour)
total.colours = 7,
col.colour = 'white',
row.colour = 'white',
bg.alpha = 1,
yaxis.tck = c(1,0),
fill.colour = 'grey95',
spot.size.function = spot.sizes,
spot.colour.function = spot.colours,
xaxis.tck = 0,
xaxis.lab = c(rep('',100)),
bottom.padding = 0,
top.padding = 0,
left.padding = 0,
right.padding = 0,
yaxis.cex = 1
);
# Dotmap legend
dotmap.legend <- list(
legend = list(
colours = bg.colours,
labels = c('Nonsynonymous','Stop Gain','Frameshift deletion',
'Nonframeshift deletion', 'Splicing', 'Unknown'),
border = 'white',
title = 'SNV',
pch = 15
),
legend = list(
colours = dotmap.dot.colours,
labels = c('Gain','Loss'),
border = 'white',
title = 'CNA',
pch = 19
)
);
dotmap.legend.grob <- legend.grob(
legends = dotmap.legend,
title.just = 'left',
label.cex = 0.7,
title.cex = 0.7
);
# Covariates
cov.colours <- c(
c('dodgerblue','pink'),
c('grey','darkseagreen1','seagreen2','springgreen3','springgreen4'),
c('peachpuff','tan4')
);
# the heatmap expects numeric data
cov.data <- patient[-c(4:9)];
cov.data[cov.data == 'male'] <- 1;
cov.data[cov.data == 'female'] <- 2;
cov.data[is.na(cov.data)] <- 3;
cov.data[cov.data == 'I'] <- 4;
cov.data[cov.data == 'II'] <- 5;
cov.data[cov.data == 'III'] <- 6;
cov.data[cov.data == 'IV'] <- 7;
cov.data[cov.data == 'MSS'] <- 8;
cov.data[cov.data == 'MSI-High'] <- 9;
cov.data$sex <- as.numeric(cov.data$sex);
cov.data$stage <- as.numeric(cov.data$stage);
cov.data$msi <- as.numeric(cov.data$msi);
covariates <- create.heatmap(
x = cov.data,
clustering.method = 'none',
colour.scheme = as.vector(cov.colours),
total.colours = 10,
row.colour = 'white',
col.colour = 'white',
grid.row = TRUE,
grid.col = TRUE,
xaxis.lab = c(rep('',100)),
yaxis.lab = c('Sex','Stage','MSI'),
yaxis.tck = c(0,0),
xaxis.tck = c(0,0),
xat = c(1:100),
print.colour.key = FALSE,
yaxis.cex = 1,
bottom.padding = 0,
top.padding = 0,
left.padding = 0,
right.padding = 0
);
#> Warning: number of colum ns exceeded limit (50), column lines are turned off.
#> Please set "force.grid.col" to TRUE to override this
## Warning: number of columns exceeded limit (50), column lines are
## turned off. Please set "force.grid.col" to TRUE to override this
# Coviate Legends
cov.legends <- list(
legend = list(
colours = cov.colours[8:9],
labels = c('MSS','MSI-High'),
border = 'white',
title = 'MSI'
),
legend = list(
colours = cov.colours[3:7],
labels = c('NA', 'I','II','III','IV'),
border = 'white',
title = 'Stage'
),
legend = list(
colours = cov.colours[1:2],
labels = c('Male','Female'),
border = 'white',
title = 'Sex'
)
);
cov.legend.grob <- legend.grob(
legends = cov.legends,
title.just = 'left',
label.cex = 0.7,
title.cex = 0.7,
layout = c(3,1)
);
create.multipanelplot(
# filename = tempfile(pattern = 'Multipanelplot_with_heatmap', fileext = '.tiff'),
plot.objects = list(dotmap,covariates),
plot.objects.heights = c(1,0.2),
y.spacing = -0.8,
main = 'Dotmap',
top.padding = 2,
layout.height = 2,
legend = list(
bottom = list(
x = 0.10,
y = 0.50,
fun = cov.legend.grob
),
right = list(
x = 0.10,
y = 0.50,
fun = dotmap.legend.grob
)
),
resolution = 300
);
 # Add more plots, using more complex layout
# grouped barplot
groupedbar.colours <- c('indianred1','indianred4');
count.SNV <- apply(SNV[1:15,], 2, function(x){length(which(!is.na(x)))});
count.CNA <- apply(CNA[1:15,], 2, function(x){length(which(!(x==0)))});
grouped.data <- data.frame(
values = c(count.SNV, count.CNA),
samples = rep(colnames(SNV),2),
group = rep(c('SNV','CNA'), each = 58)
);
grouped.barplot <- create.barplot(
formula = values ~ samples,
data = grouped.data,
groups = grouped.data$group,
col = groupedbar.colours,
top.padding = 0,
bottom.padding = 0,
left.padding = 0,
right.padding = 0,
border.col = 'white',
xlab.label = '',
ylab.label = 'Mutation',
yaxis.lab = c(0,5,10,15),
yat = c(0,5,10,15),
xaxis.lab = c(rep('',100)),
yaxis.tck = c(0,0),
xaxis.tck = c(0,0),
ylab.cex = 1.5,
yaxis.cex = 1,
axes.lwd = 2
);
# stacked barplot
col.one <- rgb(255/255, 225/255, 238/255);
col.two <- rgb(244/255, 224/255, 166/255);
col.thr <- rgb(177/255, 211/255, 154/255);
col.fou <- rgb(101/255, 180/255, 162/255);
col.fiv <- rgb(51/255, 106/255, 144/255);
stackedbar.colours <- c(col.one, col.two, col.thr, col.fou, col.fiv, 'orchid4');
stacked.data.labels <- c('C>A/G>T','C>T/G>A','C>G/G>C','T>A/A>T','T>G/A>C', 'T>C/A>G');
stacked.data <- data.frame(
values = c(patient$prop.CAGT, patient$prop.CTGA, patient$prop.CGGC, patient$prop.TAAT,
patient$prop.TGAC, patient$prop.TCAG),
divisions = rep(rownames(patient), 6),
group = rep(stacked.data.labels, each = 58)
);
# Generate stacked barplot
stacked.barplot <- create.barplot(
formula = values ~ divisions,
data = stacked.data,
groups = stacked.data$group,
stack = TRUE,
col = stackedbar.colours,
border.col = 'white',
main = '',
xlab.label = '',
ylab.label = 'Proportion',
yaxis.lab = c(0,0.4,0.8),
yat = c(0,0.4,0.8),
xaxis.lab = c(rep('',100)),
yaxis.tck = c(0,0),
xaxis.tck = c(0,0),
ylab.cex = 1.5,
yaxis.cex = 1,
axes.lwd = 2
);
# barchart legends
stackedbar.legend <- list(
legend = list(
colours = rev(stackedbar.colours),
labels = rev(stacked.data.labels),
border = 'white'
)
);
groupedbar.legend <- list(
legend = list(
colours = groupedbar.colours,
labels = c('CNA','SNV'),
border = 'white'
)
);
groupedbar.legend.grob <- legend.grob(
legends = groupedbar.legend,
title.just = 'left',
label.cex = 0.7,
title.cex = 0.7
);
stackedbar.legend.grob <- legend.grob(
legends = stackedbar.legend,
title.just = 'left',
label.cex = 0.7,
title.cex = 0.7
);
# Expression change Segplot
# locate matching genes
rows.to.keep <- which(match(rownames(microarray), rownames(SNV)[1:15], nomatch = 0) > 0);
segplot.data <- data.frame(
min = apply(microarray[rows.to.keep,1:58], 1, min),
max = apply(microarray[rows.to.keep,1:58], 1, max),
median = apply(microarray[rows.to.keep,1:58], 1, median),
order = seq(1,15,1)
);
segplot <- create.segplot(
formula = order ~ min + max,
data = segplot.data,
main = '',
xlab.label = '',
ylab.label = '',
centers = segplot.data$median,
yaxis.lab = c('','','','','',''),
xaxis.lab = c('0','2','4','6','8'),
xat = c(0,2,4,6,8),
yaxis.tck = c(0,0),
xaxis.tck = c(1,0),
axes.lwd = 2,
top.padding = 0,
left.padding = 0,
right.padding = 0,
bottom.padding = 0
);
# Create multiplot
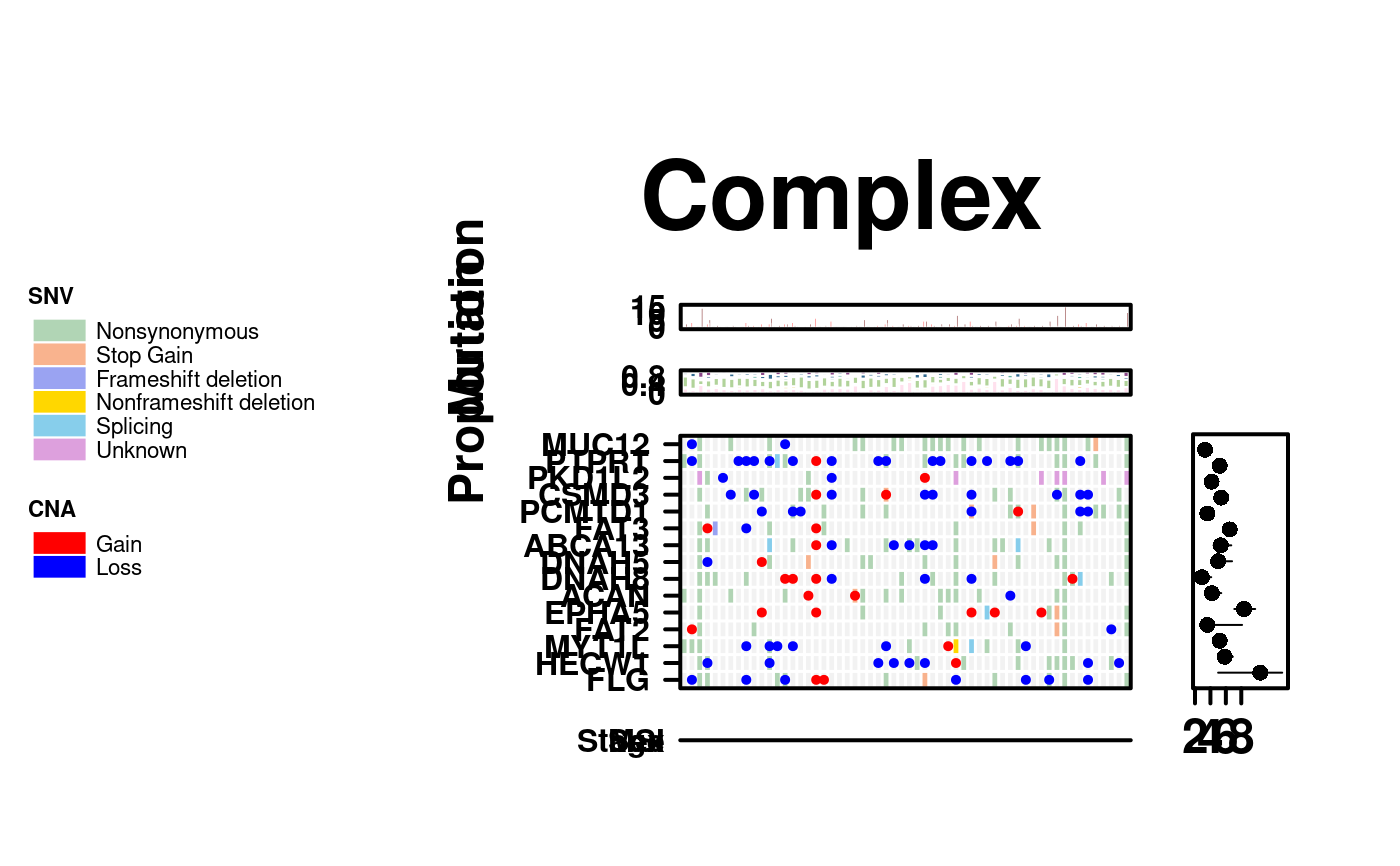
plots <- list(grouped.barplot,stacked.barplot,dotmap, segplot,covariates);
create.multipanelplot(
main.x = 0.47,
main.y = 0.5,
plot.objects = plots,
plot.objects.heights = c(0.3, 0.3, 1, 0.15),
plot.objects.widths = c(1,0.2),
# filename = tempfile(pattern = 'Multipanelplot_Complex', fileext = '.tiff'),
layout.height = 4,
layout.width = 2,
x.spacing = 0.2,
left.padding = 0,
layout.skip = c(FALSE,TRUE,FALSE,TRUE,FALSE,FALSE,FALSE,TRUE),
y.spacing = c(-1.35,-1.35,-1.5),
ylab.axis.padding = c(1,0),
legend = list(
left = list(
fun = dotmap.legend.grob,
args = list(
key = list(
points = list(
pch = c(15,15,19,19)
)
)
)
)
),
height = 12,
width = 12,
main = 'Complex',
top.padding = 2
);
#> Warning: number of columns of result is not a multiple of vector length (arg 2)
 # Create a multiplot with a heatmap, key like legend and barplot
# First create a heatmap object
simple.heatmap <- create.heatmap(patient[, 4:6],
clustering.method = 'none',
print.colour.key = FALSE,
same.as.matrix = FALSE,
colour.scheme = c('gray0','grey100'),
fill.colour = 'grey95',
xaxis.lab = c(rep('',100)),
xat = c(0,1,2,3,4,5,6,7,8),
yaxis.lab = c('','',''),
yat = c(0,1,2),
xlab.label = ''
);
# and a simple bar plot
pvals <- data.frame(
order = c(1:3),
pvalue = -log10(c(0.0004, 0.045, 0.0001)),
stringsAsFactors = FALSE
)
#create bar plot
simple.bar <- create.barplot(
formula = order ~ rev(pvalue),
data = pvals,
xlimits = c(0,5),
plot.horizontal=TRUE,
xlab.label = '',
ylab.label = '',
yaxis.lab = c(1,2,3)
);
# then the covariates heatmap
cov.colours <- c(
c('dodgerblue','pink'),
c('grey','darkseagreen1','seagreen2','springgreen3','springgreen4'),
c('peachpuff','tan4')
);
# the heatmap expects numeric data
cov.data <- patient[-c(4:9)];
cov.data[cov.data == 'male'] <- 1;
cov.data[cov.data == 'female'] <- 2;
cov.data[is.na(cov.data)] <- 3;
cov.data[cov.data == 'I'] <- 4;
cov.data[cov.data == 'II'] <- 5;
cov.data[cov.data == 'III'] <- 6;
cov.data[cov.data == 'IV'] <- 7;
cov.data[cov.data == 'MSS'] <- 8;
cov.data[cov.data == 'MSI-High'] <- 9;
cov.data$sex <- as.numeric(cov.data$sex);
cov.data$stage <- as.numeric(cov.data$stage);
cov.data$msi <- as.numeric(cov.data$msi);
covariates <- create.heatmap(
x = cov.data,
clustering.method = 'none',
colour.scheme = as.vector(cov.colours),
total.colours = 10,
row.colour = 'white',
col.colour = 'white',
grid.row = TRUE,
grid.col = TRUE,
yaxis.tck = 0,
print.colour.key = FALSE,
xaxis.lab = c('','',''),
xlab.label = '',
xat = c(1,2,3)
);
#> Warning: number of colum ns exceeded limit (50), column lines are turned off.
#> Please set "force.grid.col" to TRUE to override this
## Warning: number of columns exceeded limit (50), column
## lines are turned off. Please set "force.grid.col" to TRUE to override this
covariates2 <- create.heatmap(
x = patient[4],
clustering.method = 'none',
colour.scheme = c("#00007F", "#007FFF"),
row.colour = 'white',
col.colour = 'white',
grid.row = TRUE,
grid.col = TRUE,
yaxis.tck = 0,
print.colour.key = FALSE,
xaxis.lab = c('','',''),
xlab.label = '',
xat = c(1,2,3)
);
#> Warning: number of rows exceeded limit (50), row lines are turned off.
#> Please set "force.grid.row" to TRUE to override this
## Warning: number of rows exceeded limit (50), row
## lines are turned off. Please set "force.grid.row" to TRUE to override this
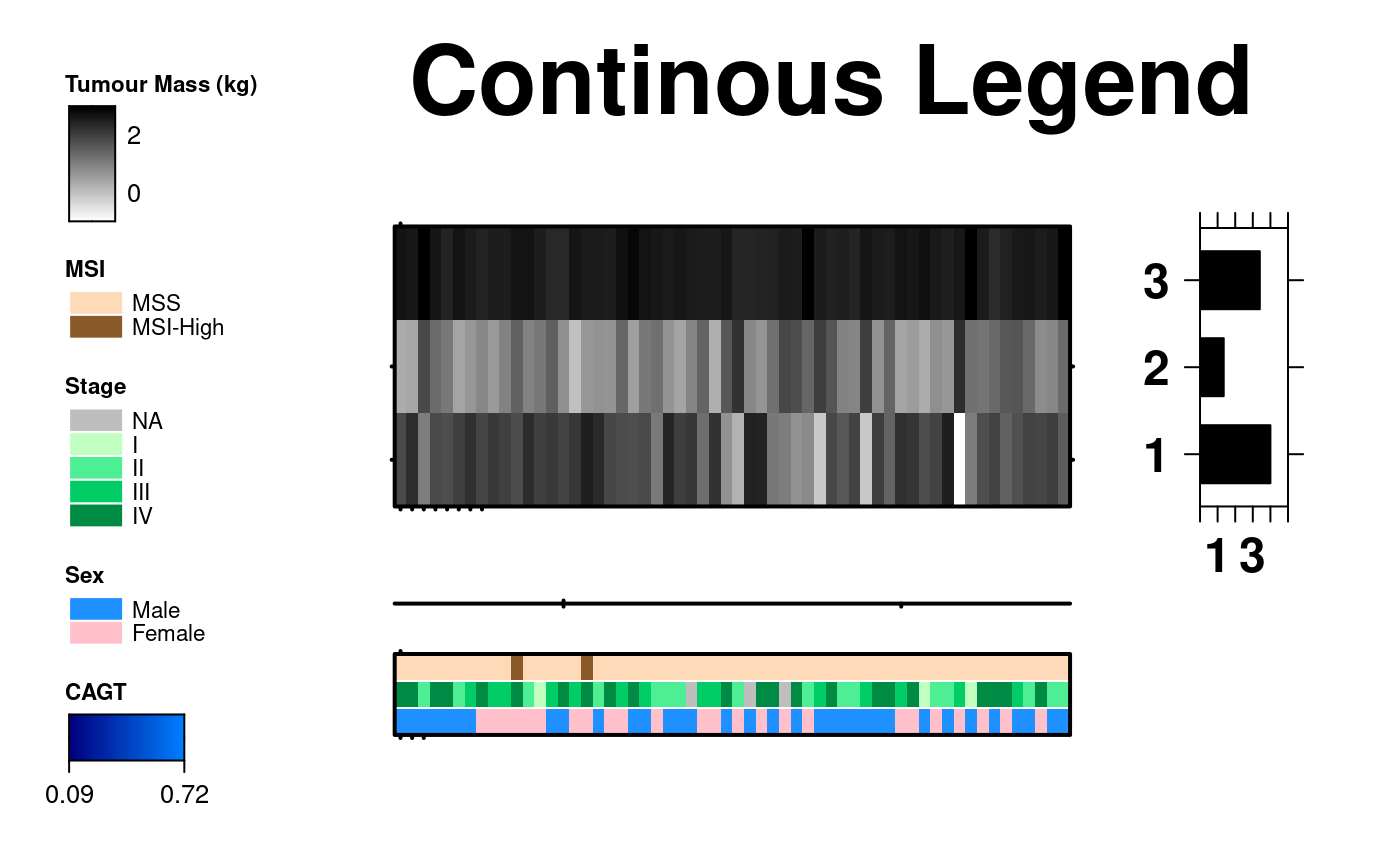
cov.legends <- list(
legend = list(
colours = c("white", "black"),
labels = c('0','2'),
border = 'grey',
title = 'Tumour Mass (kg)',
continuous = TRUE,
height = 3
),
legend = list(
colours = cov.colours[8:9],
labels = c('MSS','MSI-High'),
border = 'white',
title = 'MSI'
),
legend = list(
colours = cov.colours[3:7],
labels = c('NA', 'I','II','III','IV'),
border = 'white',
title = 'Stage'
),
legend = list(
colours = cov.colours[1:2],
labels = c('Male','Female'),
border = 'white',
title = 'Sex'
),
legend = list(
colours = c("#00007F", "#007FFF"),
labels = c('0.09','0.72'),
border = 'grey',
title = 'CAGT',
continuous = TRUE,
height = 2,
width = 3,
angle = -90,
tck = 1,
tck.number = 2,
at = c(0,100)
)
);
cov.legend.grob <- legend.grob(
legends = cov.legends,
title.just = 'left',
label.cex = 0.7,
title.cex = 0.7
);
# Now bring it was together using multiplot
create.multipanelplot(
# filename = tempfile(pattern = 'Multipanelplot_continousLegend', fileext = '.tiff'),
plot.objects = list(simple.heatmap, simple.bar,covariates2,covariates),
plot.objects.heights = c(1,0.1,0.35),
plot.objects.widths = c(1,0.25),
layout.height = 3,
layout.width = 2,
layout.skip = c(FALSE, FALSE,FALSE,TRUE,FALSE,TRUE),
y.spacing = -0.1,
x.spacing = 0.5,
legend = list(
left = list(
fun = cov.legend.grob
)
),
main = 'Continous Legend',
top.legend.padding = 4,
top.padding = -2,
left.padding = 1
# This parameter must be set for the legend to appear
);
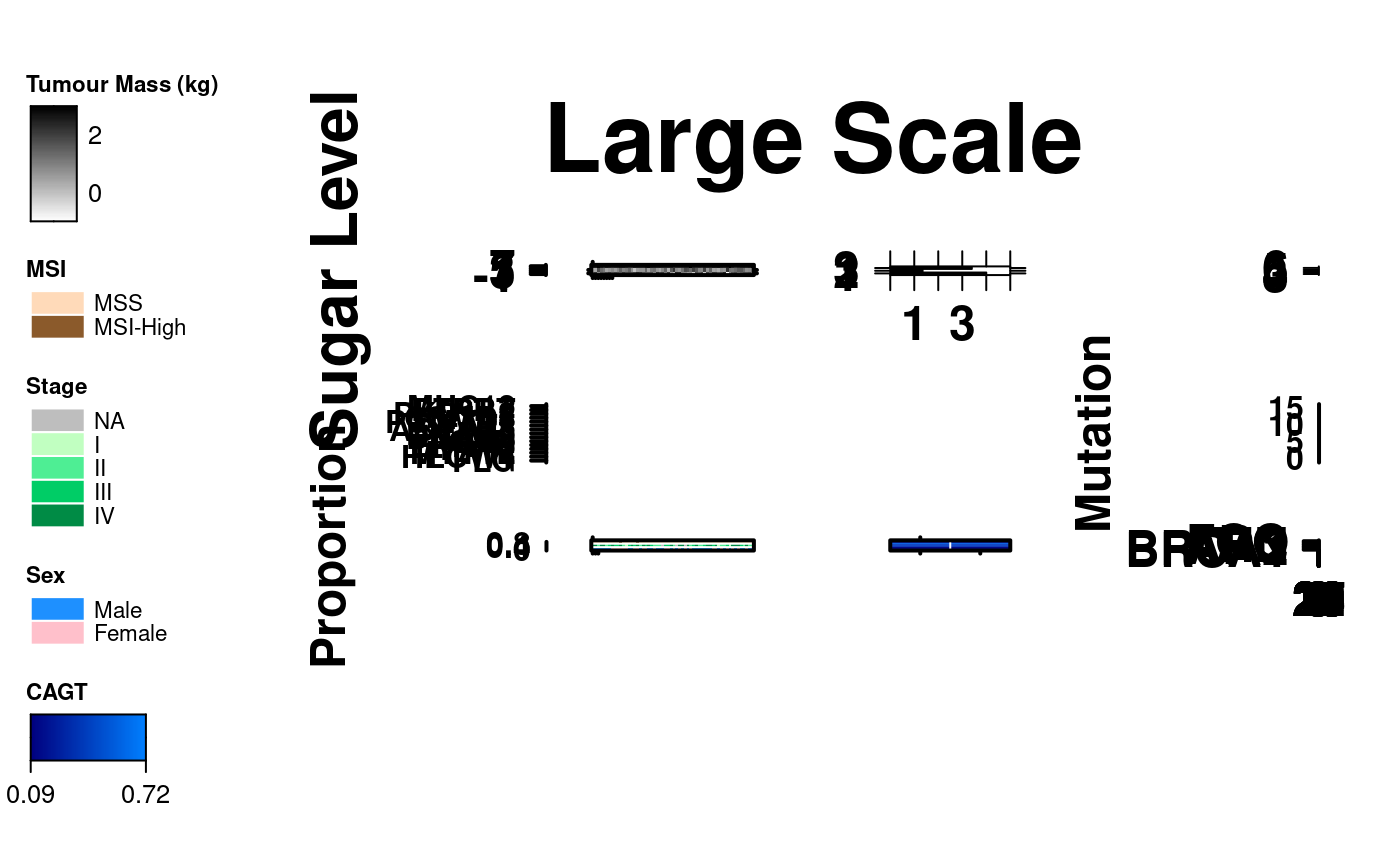
 create.multipanelplot(
# filename = tempfile(pattern = 'Multipanelplot_manyPlots', fileext = '.tiff'),
main = 'Large Scale',
plot.objects = list(
simple.boxplot,
simple.heatmap,
simple.bar,
barplot.formatted,
dotmap,
grouped.barplot,
stacked.barplot,
covariates,
covariates2,
heatmap.formatted
),
plot.objects.heights = c(1,1,1,1),
plot.objects.widths = c(1,1, 1,1),
layout.height = 4,
layout.width = 4,
top.legend.padding = 3,
layout.skip = c(FALSE, FALSE,FALSE,FALSE,FALSE,TRUE,
TRUE,FALSE,FALSE,FALSE,FALSE,FALSE,FALSE,FALSE,TRUE,TRUE),
y.spacing = c(-1,-1,-1),
x.spacing = c(1,2,3),
legend = list(
left = list(
fun = cov.legend.grob
)
),
height = 12,
width = 12
# This parameter must be set for the legend to appear
);
#> Warning: number of columns of result is not a multiple of vector length (arg 2)
#> Warning: number of columns of result is not a multiple of vector length (arg 2)
 # }
# }