Make a dotmap with coloured background
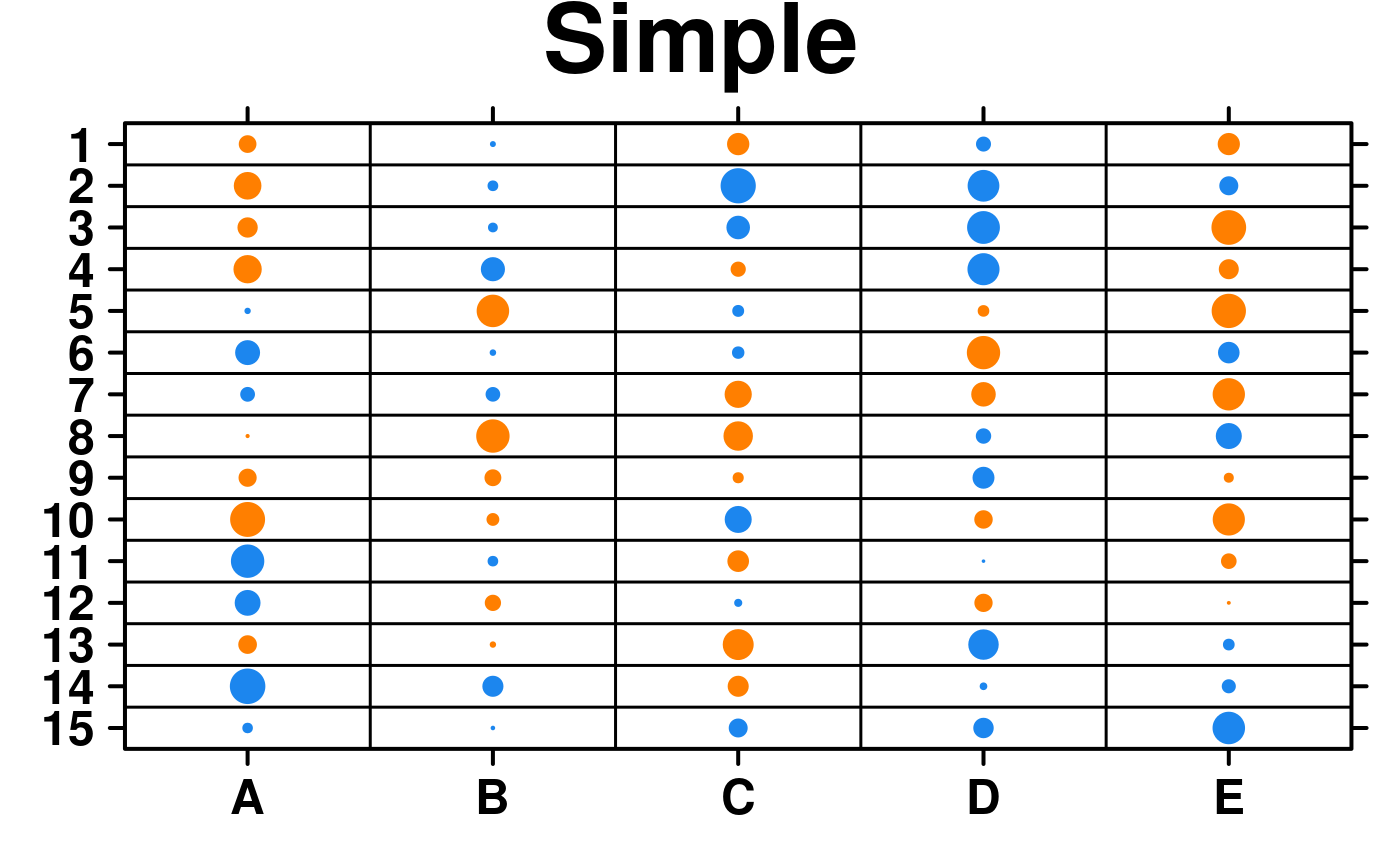
create.dotmap.RdTakes two data.frames and creates a dotmap with a coloured background. A dotmap is an ordered array of evenly-spaced dots whose size and colour can be user-specified to represent characteristics. For example, size gives the absolute magnitude of the correlation and colour gives the sign of the correlation. The coloured background may indicate p-values.
Usage
create.dotmap(
  x,
  bg.data = NULL,
  filename = NULL,
  main = NULL,
  main.just = "center",
  main.x = 0.5,
  main.y = 0.5,
  pch = 19,
  pch.border.col = 'black',
  add.grid = TRUE,
  xaxis.lab = colnames(x),
  yaxis.lab = rownames(x),
  xaxis.rot = 0,
  yaxis.rot = 0,
  main.cex = 3,
  xlab.cex = 2,
  ylab.cex = 2,
  xlab.label = NULL,
  ylab.label = NULL,
  xlab.col = 'black',
  ylab.col = 'black',
  xlab.top.label = NULL,
  xlab.top.cex = 2,
  xlab.top.col = 'black',
  xlab.top.just = "center",
  xlab.top.x = 0.5,
  xlab.top.y = 0,
  xaxis.cex = 1.5,
  yaxis.cex = 1.5,
  xaxis.col = 'black',
  yaxis.col = 'black',
  xaxis.tck = 1,
  yaxis.tck = 1,
  axis.top = 1,
  axis.bottom = 1,
  axis.left = 1,
  axis.right = 1,
  top.padding = 0.1,
  bottom.padding = 0.7,
  right.padding = 0.1,
  left.padding = 0.5,
  key.ylab.padding = 0.1,
  key = list(text = list(lab = c(''))),
  legend = NULL,
  col.lwd = 1.5,
  row.lwd = 1.5,
  spot.size.function = 'default',
  spot.colour.function = 'default',
  na.spot.size = 7,
  na.pch = 4,
  na.spot.size.colour = 'black',
  grid.colour = NULL,
  colour.scheme = 'white',
  total.colours = 99,
  at = NULL,
  colour.centering.value = 0,
  colourkey = FALSE,
  colourkey.labels.at = NULL,
  colourkey.labels = NULL,
  colourkey.cex = 1,
  colour.alpha = 1,
  bg.alpha = 0.5,
  fill.colour = 'white',
  key.top = 0.1,
  height = 6,
  width = 6,
  size.units = 'in',
  resolution = 1600,
  enable.warnings = FALSE,
  col.colour = 'black',
  row.colour = 'black',
  description = 'Created with BoutrosLab.plotting.general',
  add.rectangle = FALSE,
  xleft.rectangle = NULL,
  ybottom.rectangle = NULL,
  xright.rectangle = NULL,
  ytop.rectangle = NULL,
  col.rectangle = 'transparent',
  border.rectangle = NULL,
  lwd.rectangle = NULL,
  alpha.rectangle = 1,
  xaxis.fontface = 'bold',
  yaxis.fontface = 'bold',
  dot.colour.scheme = NULL,
  style = 'BoutrosLab',
  preload.default = 'custom',
        use.legacy.settings = FALSE,
  remove.symmetric = FALSE,
        lwd = 2
);
Arguments
- x
An unstacked data.frame to plot the dotmap
- bg.data
An unstacked data.frame to plot the background, of the same size as “x”. Column names specified here may be arbitrary: they are not used in the plot.
- filename
Filename for tiff output, or if NULL returns the trellis object itself
- pch
Plotting character
- pch.border.col
Colour of the dot border if using pch = 21:25
- add.grid
Should a grid of black-lines separating each column/row be added?
- main
The main title for the plot (space is reclaimed if NULL)
- main.just
The justification of the main title for the plot, default is centered
- main.x
The x location of the main title, deault is 0.5
- main.y
The y location of the main title, default is 0.5
- xlab.label
The label for the x-axis
- ylab.label
The label for the y-axis
- xlab.col
Colour of the x-axis label, defaults to “black”
- ylab.col
Colour of the y-axis label, defaults to “black”
- xlab.top.label
The label for the top x-axis
- xlab.top.cex
Size of top x-axis label
- xlab.top.col
Colour of the top x-axis label
- xlab.top.just
Justification of the top x-axis label, defaults to centered
- xlab.top.x
The x location of the top x-axis label
- xlab.top.y
The y location of the top y-axis label
- main.cex
Size of text for the main title, defaults to 2
- xlab.cex
Size of x-axis label, defaults to 2
- ylab.cex
Size of y-axis label, defaults to 2
- xaxis.lab
Vector listing x-axis tick labels, defaults to colnames(x)
- yaxis.lab
Vector listing y-axis tick labels, defaults to rownames(x)
- xaxis.cex
Size of x-axis tick labels, defaults to 1.2
- yaxis.cex
Size of y-axis tick labels, defaults to 1.5
- xaxis.rot
Rotation of x-axis tick labels; defaults to 0
- yaxis.rot
Rotation of y-axis tick labels; defaults to 0
- xaxis.col
Colour of the x-axis tick labels, defaults to “black”
- yaxis.col
Colour of the y-axis tick labels, defaults to “black”
- xaxis.tck
Specifies the length of the tick marks for x-axis, defaults to 1
- yaxis.tck
Specifies the length of the tick marks for y-axis, defaults to 1
- axis.top
Specifies the padding on the top of the plot
- axis.bottom
Specifies the padding on the bottom of the plot
- axis.left
Specifies the padding on the left of the plot
- axis.right
Specifies the padding on the right of the plot
- top.padding
A number specifying the distance to the top margin, defaults to 0.1
- bottom.padding
A number specifying the distance to the bottom margin, defaults to 0.7
- right.padding
A number specifying the distance to the right margin, defaults to 0.1
- left.padding
A number specifying the distance to the left margin, defaults to 0.5
- key.ylab.padding
a number specifying distance between key and left label
- key
A list giving the key (legend). The default suppresses drawing. If the key has a “space” component then extra space will be cleared on that side of the plot for the key
- legend
Add a legend to the plot. Helpful for adding multiple keys and adding keys to the margins of the plot. See xyplot.
- col.lwd
Thickness of column grid lines
- row.lwd
Thickness of row grid lines
- spot.size.function
The function that translates values in x into dotmap spot-size. The default is 0.1 + (2 * abs(x))
- spot.colour.function
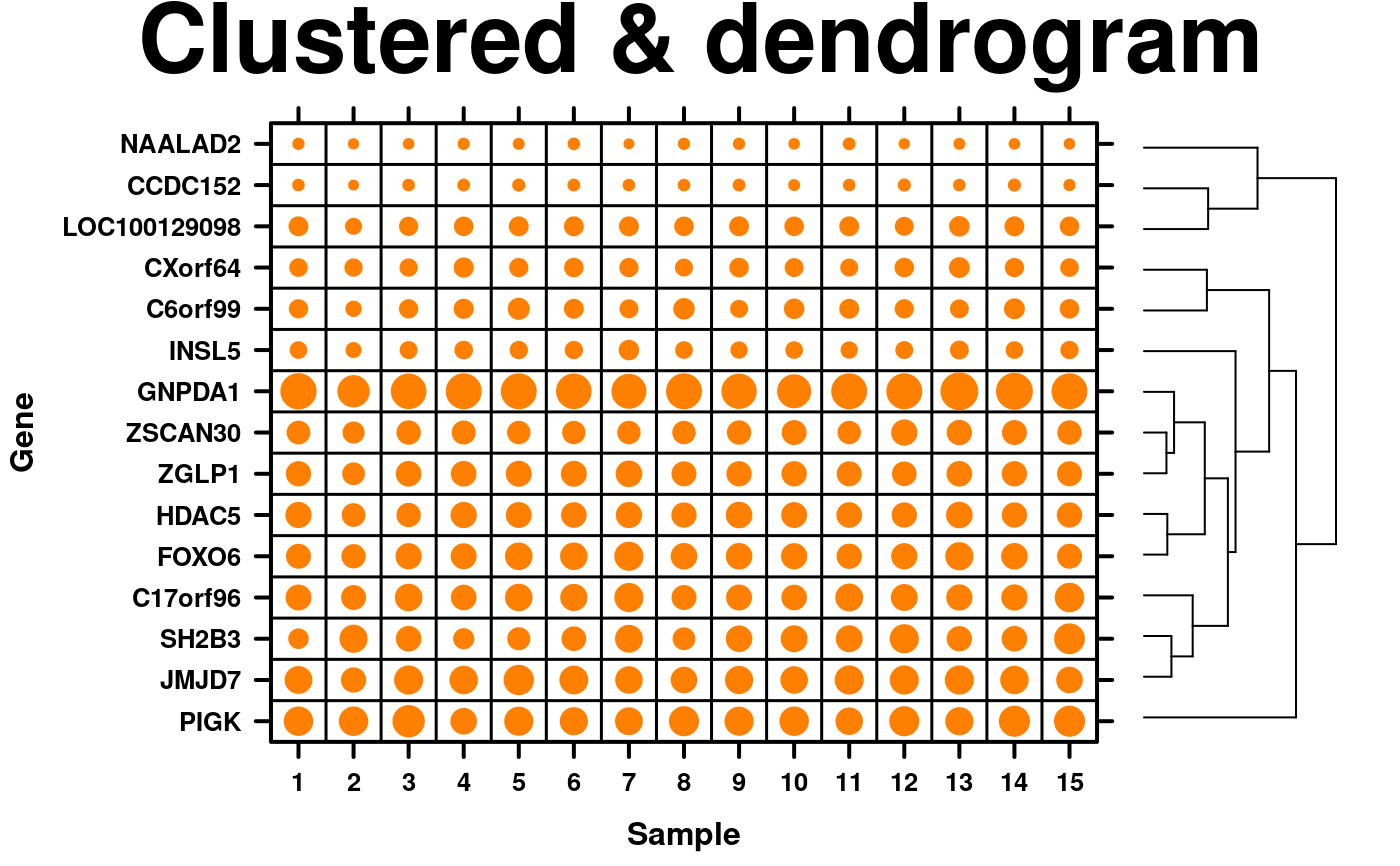
The function that translates values in x into dotmap spot-colour. The default gives negative values blue, positive values red, and zero white. Parameter also accepts 'columns' and 'rows', which groups the dot colours by columns or rows (not both), respectively. For column/row grouping, there are 12 unique colours and these colours will start to repeat once there are more than 12 columns/rows.
- na.spot.size
The size for plotting character for NA cells. Defaults to 7.
- na.pch
The type of plotting character to represent NA cells. Defaults to 4 ('X').
- na.spot.size.colour
Colour for plotting character representing NA cells. Defaults to black.
- grid.colour
The colour for the grid lines. DEPRECATED
- colour.scheme
Background colouring. Accepts a vector of colours. Vectors of two or three colours are gradiated to create the final palette. Defaults to “white”.
- total.colours
Total number of colours to plot for the Background colours
- at
A vector specifying the breakpoints along the range of bg; each interval specified by these breakpoints are assigned to a colour from the palette. Defaults to NULL, which corresponds to the range of bg being divided into total.colours equally spaced intervals. If bg has values outside of the range specified by “at”, those values are shown with colours corresponding to the extreme ends of the colour spectrum and a warning is given.
- colour.centering.value
What should be the center of the background key
- colourkey
Determines if the colour key should be added or not and sets up its formatting. Defaults to FALSE.
- colourkey.labels.at
A vector specifying the tick-positions on the background colourkey
- colourkey.labels
A vector specifying tick-labels of the background colourkey
- colourkey.cex
Size of the background colourkey label text
- colour.alpha
Bias to be added to background colour selection (uses x^colour.alpha in mapping)
- bg.alpha
The alpha value of the background colours, defaults to 0.5 so that the background does not compete with the dot colours for attention.
- fill.colour
The background fill colour (only exposed where missing values are present). Defaults to white. NOTE: If you change this colour, you may want to set bg.alpha to 1 to avoid the fill colour showing through
- key.top
A number specifying the distance at top of key, defaults to 0.1
- height
Figure height in size.units
- width
Figure width in size.units
- size.units
Units of size for the figure
- resolution
Figure resolution in dpi
- enable.warnings
Print warnings if set to TRUE, defaults to FALSE
- col.colour
The colour for the column grid lines, defaults to “black”. Can be a vector.
- row.colour
The colour for the row grid lines, defaults to “black”. Can be a vector.
- description
Description of image/plot; default NULL.
- add.rectangle
Allow a rectangle to be drawn, default is FALSE
- xleft.rectangle
Specifies the left x ooordinate of the rectangle to be drawn
- ybottom.rectangle
Specifies the bottom y coordinate of the rectangle to be drawn
- xright.rectangle
Specifies the right x coordinate of the rectangle to be drawn
- ytop.rectangle
Specifies the top y coordinate of the rectangle to be drawn
- col.rectangle
Specifies the colour to fill the rectangle's area
- alpha.rectangle
Specifies the colour bias of the rectangle to be drawn
- border.rectangle
Specifies the colour of the rectangle border
- lwd.rectangle
Specifies the thickness of the rectangle border
- xaxis.fontface
Fontface for the x-axis scales
- yaxis.fontface
Fontface for the y-axis scales
- dot.colour.scheme
Colour Scheme for the dots
- style
defaults to “BoutrosLab”, also accepts “Nature”, which changes parameters according to Nature formatting requirements
- preload.default
ability to set multiple sets of diffrent defaults depending on publication needs
- use.legacy.settings
boolean to set wheter or not to use legacy mode settings (font)
- remove.symmetric
boolean to set whether or not to remove the top left half of a symettrically sized matrix
- lwd
line width for the axis lines
Details
It would be nice to have a library of suitable spot.size and spot.colour functions.
    Earlier ideas included:
    (1) Changing the dot shape to triangles, so that upward or downward-pointing dots indicated direction of change. This would allow dot colour to be used to encode something else. This idea was not used because in the case of very small dots, the direction of the triangle might not be visible.
    (2) Adding arrows above or below dots to indicate direction of change. This idea was not used because there may not always be enough space present to add such arrows.
    (3) Adding line(s) in the background set at different angles to show data. This was found to be not intuitive to read.

A future addition may be to add the option of outlining boxes instead of adding a background. This would be applicable in cases where there is very little background space, and consequently, the background colour would not be very visible.
Value
If filename is NULL then returns the trellis object, otherwise creates a plot and returns a 0/1 success code.
Warning
If this function is called without capturing the return value, or specifying a filename, it may crash while trying to draw the histogram. In particular, if a script that uses such a call of create histogram is called by reading the script in from the command line, it will fail badly, with an error message about unavailable fonts:
    Error in grid.Call.graphics("L_text", as.graphicsAnnot(x$label), x$x,  )
        Invalid font type
    Calls: print ... drawDetails.text -> grid.Call.graphics -> .Call.graphics
Examples
set.seed(12345);
simple.data <- data.frame(
'A' = runif(n = 15, min = -1, max = 1),
'B' = runif(n = 15, min = -1, max = 1),
'C' = runif(n = 15, min = -1, max = 1),
'D' = runif(n = 15, min = -1, max = 1),
'E' = runif(n = 15, min = -1, max = 1)
);
create.dotmap(
# filename = tempfile(pattern = 'Dotmap_Simple', fileext = '.tiff'),
x = simple.data,
main = 'Simple',
description = 'Dotmap created by BoutrosLab.plotting.general',
resolution = 100
);
 # create a function to determine the spot sizes (default function works best with values < 1)
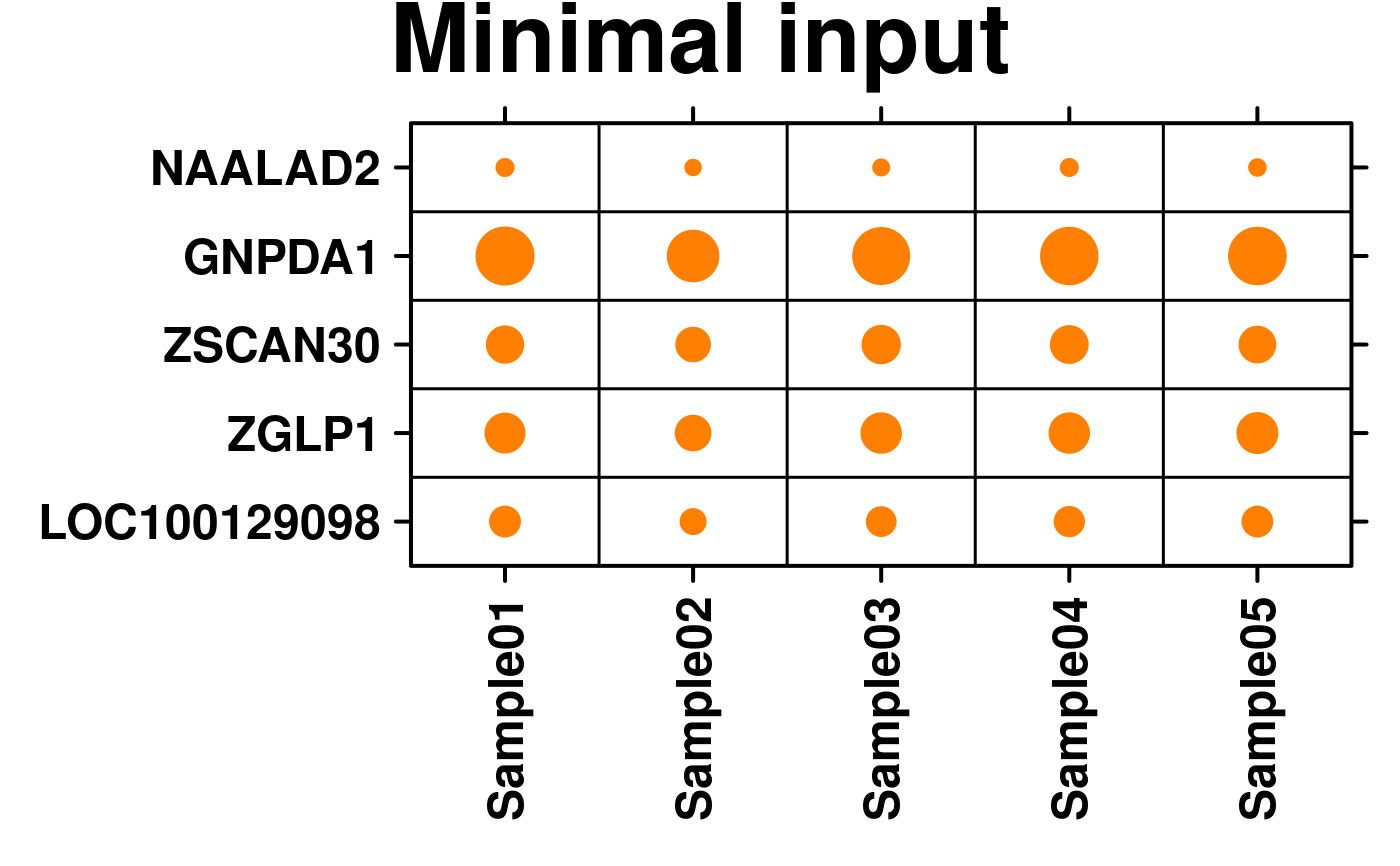
spot.size.med <- function(x) {abs(x)/3;}
# Minimal Input
create.dotmap(
# filename = tempfile(pattern = 'Dotmap_Minimal_Input', fileext = '.tiff'),
x = microarray[1:5,1:5],
main = 'Minimal input',
spot.size.function = spot.size.med,
xaxis.rot = 90,
description = 'Dotmap created by BoutrosLab.plotting.general',
resolution = 100
);
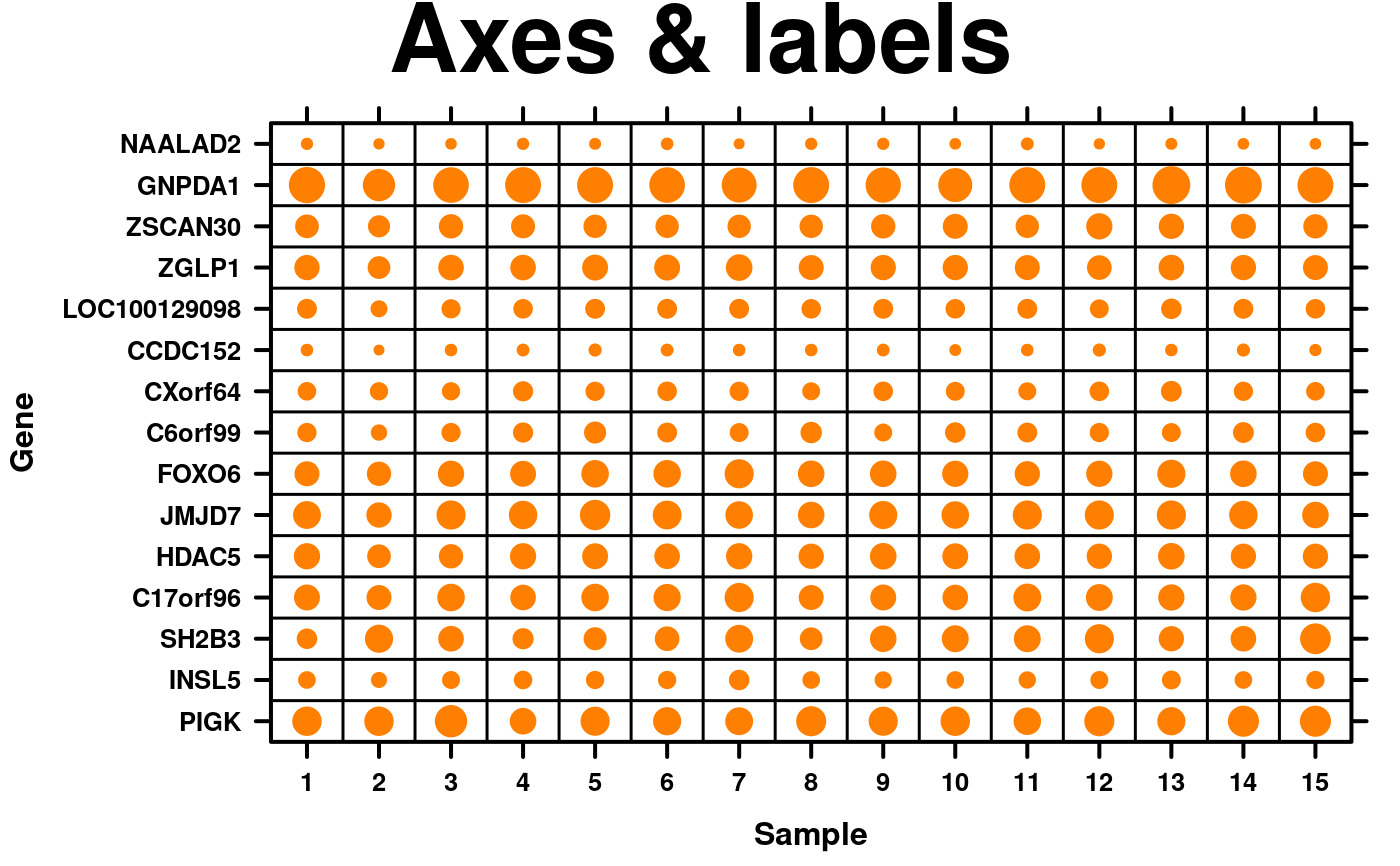
 # Axes & Labels
spot.size.small <- function(x) {abs(x)/5;}
create.dotmap(
# filename = tempfile(pattern = 'Dotmap_Axes_Labels', fileext = '.tiff'),
x = microarray[1:15,1:15],
main = 'Axes & labels',
spot.size.function = spot.size.small,
# Adjusting the font sizes and labels
xaxis.cex = 0.8,
yaxis.cex = 0.8,
xaxis.lab = 1:15,
xlab.label = 'Sample',
ylab.label = 'Gene',
xlab.cex = 1,
ylab.cex = 1,
description = 'Dotmap created by BoutrosLab.plotting.general',
resolution = 100
);
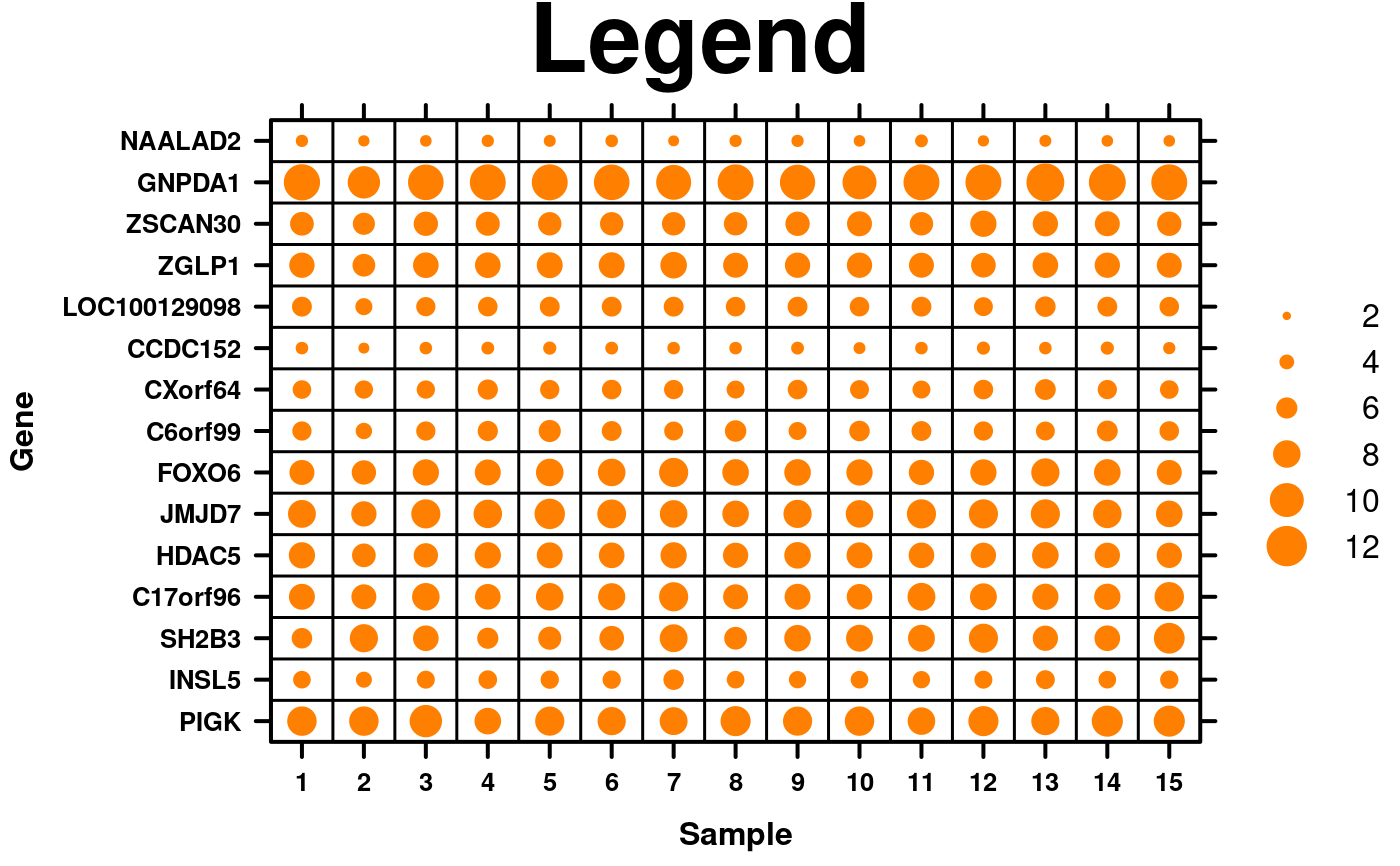
 # Legend
key.sizes <- seq(2,12,2);
create.dotmap(
# filename = tempfile(pattern = 'Dotmap_Legend', fileext = '.tiff'),
x = microarray[1:15,1:15],
main = 'Legend',
spot.size.function = spot.size.small,
xaxis.cex = 0.8,
yaxis.cex = 0.8,
xaxis.lab = 1:15,
xlab.label = 'Sample',
ylab.label = 'Gene',
xlab.cex = 1,
ylab.cex = 1,
# Legend for dots
key = list(
space = 'right',
points = list(
cex = spot.size.small(key.sizes),
col = default.colours(2, palette.type = 'dotmap')[2],
pch = 19
),
text = list(
lab = as.character(key.sizes),
cex = 1,
adj = 1
),
padding.text = 3,
background = 'white'
),
key.top = 1,
description = 'Dotmap created by BoutrosLab.plotting.general',
resolution = 100
);
# Legend
key.sizes <- seq(2,12,2);
create.dotmap(
# filename = tempfile(pattern = 'Dotmap_Legend', fileext = '.tiff'),
x = microarray[1:15,1:15],
main = 'Legend',
spot.size.function = spot.size.small,
xaxis.cex = 0.8,
yaxis.cex = 0.8,
xaxis.lab = 1:15,
xlab.label = 'Sample',
ylab.label = 'Gene',
xlab.cex = 1,
ylab.cex = 1,
# Legend for dots
key = list(
space = 'right',
points = list(
cex = spot.size.small(key.sizes),
col = default.colours(2, palette.type = 'dotmap')[2],
pch = 19
),
text = list(
lab = as.character(key.sizes),
cex = 1,
adj = 1
),
padding.text = 3,
background = 'white'
),
key.top = 1,
description = 'Dotmap created by BoutrosLab.plotting.general',
resolution = 100
);
 # \donttest{
# Cluster by dots and add dendrogram
plot.data <- microarray[1:15,1:15];
# cluster data
clustered.data <- diana(plot.data);
# order data by cluster
plot.data <- plot.data[clustered.data$order,];
# create dendogram
dendrogram.data <- create.dendrogram(x = plot.data, clustering.method = 'diana',
cluster.dimension = 'row');
dendrogram.grob <- latticeExtra::dendrogramGrob(
x = dendrogram.data,
side = 'right',
type = 'rectangle'
);
# create dotmap
create.dotmap(
x = plot.data,
# filename = tempfile(pattern = 'Dotmap_clustered_dendrogram', fileext = '.tiff'),
main = 'Clustered & dendrogram',
spot.size.function = spot.size.small,
# Adjusting the font sizes and labels
xaxis.cex = 0.8,
yaxis.cex = 0.8,
xaxis.lab = 1:15,
xlab.label = 'Sample',
ylab.label = 'Gene',
xlab.cex = 1,
ylab.cex = 1,
legend = list(
right = list(fun = dendrogram.grob)
),
right.padding = 4,
description = 'Dotmap created by BoutrosLab.plotting.general',
resolution = 100
);
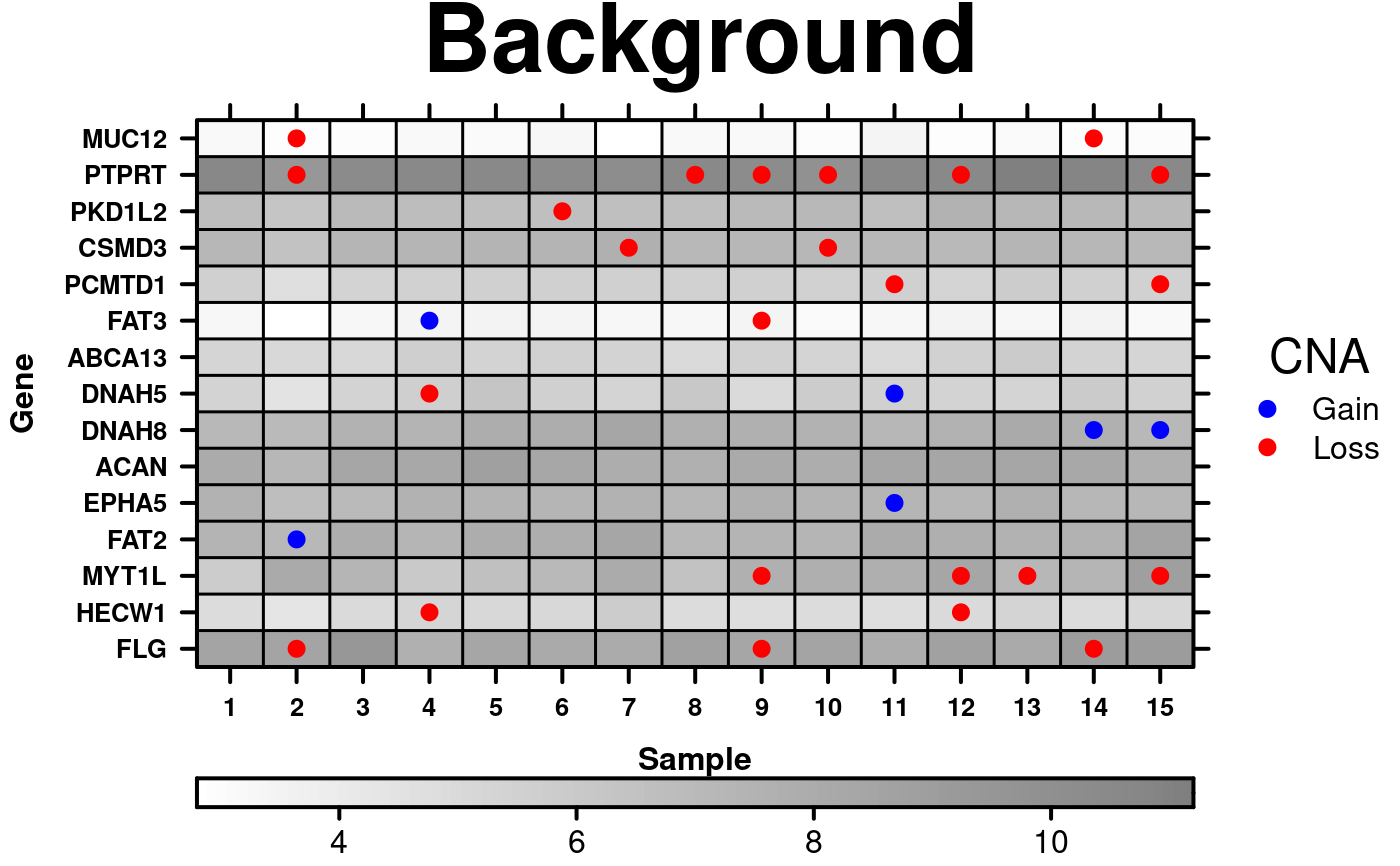
 # Add background data
key.sizes <- c(-1, 1);
CNA.colour.function <- function(x){
colours <- rep('white', length(x));
colours[sign(x) == 1] <- 'Red';
colours[sign(x) == -1] <- 'Blue';
colours[x == 0] <- 'transparent';
return(colours);
}
create.dotmap(
# filename = tempfile(pattern = 'Dotmap_with_Background', fileext = '.tiff'),
# added new data for the dots
x = CNA[1:15,1:15],
# Moving the dot-data to be background data
bg.data = microarray[1:15,1:15],
colour.scheme = c('white','black'),
main = 'Background',
spot.size.function = 1,
spot.colour.function = CNA.colour.function,
xaxis.cex = 0.8,
yaxis.cex = 0.8,
xaxis.lab = 1:15,
xlab.label = 'Sample',
ylab.label = 'Gene',
xlab.cex = 1,
ylab.cex = 1,
key = list(
space = 'right',
points = list(
cex = 1,
col = CNA.colour.function(key.sizes),
pch = 19
),
text = list(
lab = c('Gain', 'Loss'),
cex = 1,
adj = 1
),
title = 'CNA',
padding.text = 2,
background = 'white'
),
# Adding colourkey for background data
colourkey = TRUE,
key.top = 1,
description = 'Dotmap created by BoutrosLab.plotting.general',
resolution = 200
);
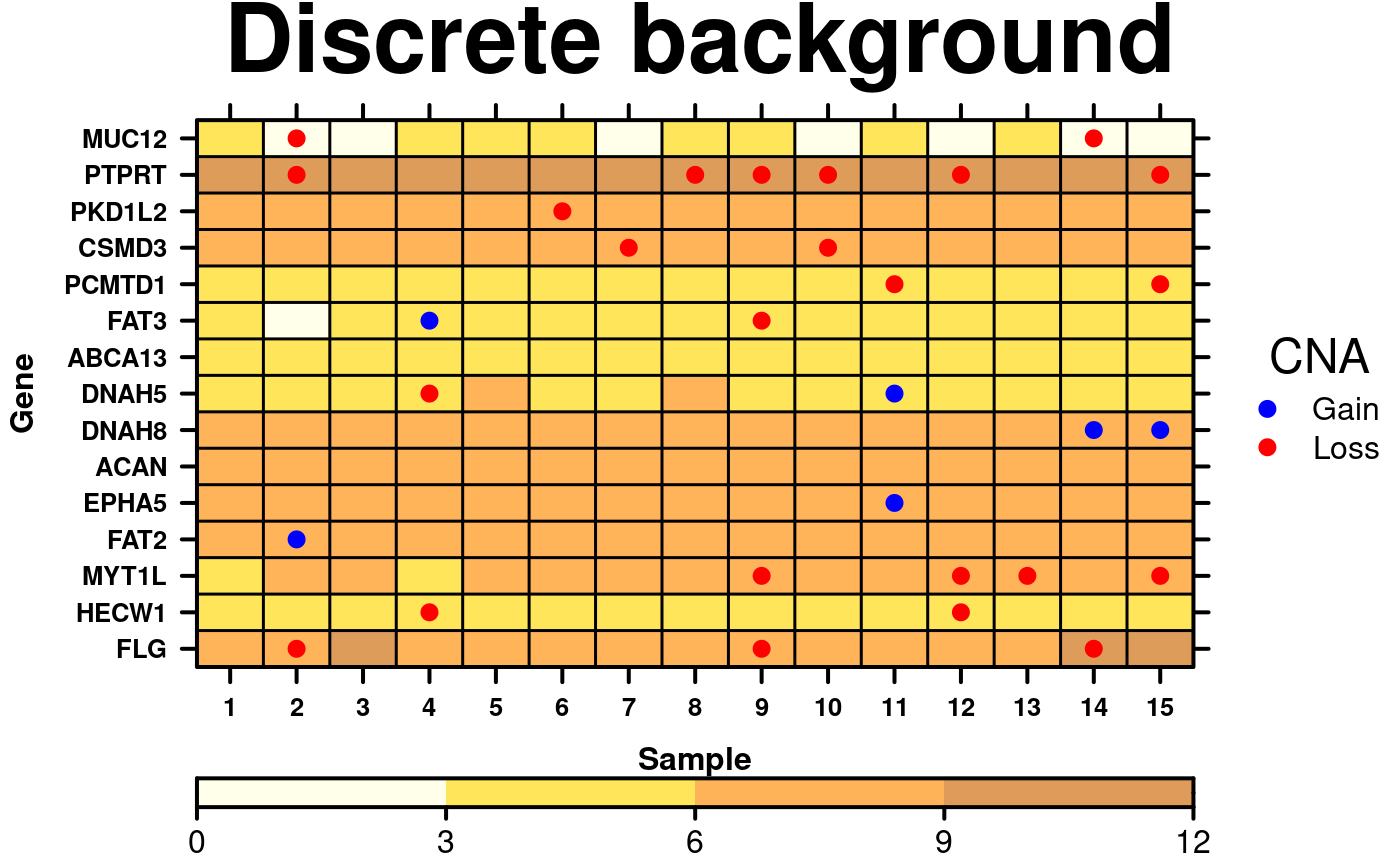
 # Discrete background colours
create.dotmap(
# filename = tempfile(pattern = 'Dotmap_Discrete_Background', fileext = '.tiff'),
x = CNA[1:15,1:15],
bg.data = microarray[1:15,1:15],
main = 'Discrete background',
spot.size.function = 1,
spot.colour.function = CNA.colour.function,
xaxis.cex = 0.8,
yaxis.cex = 0.8,
xaxis.lab = 1:15,
xlab.label = 'Sample',
ylab.label = 'Gene',
xlab.cex = 1,
ylab.cex = 1,
key = list(
space = 'right',
points = list(
cex = 1,
col = CNA.colour.function(key.sizes),
pch = 19
),
text = list(
lab = c('Gain', 'Loss'),
cex = 1,
adj = 1
),
title = 'CNA',
padding.text = 2,
background = 'white'
),
colourkey = TRUE,
key.top = 1,
# Changing background colour scheme
colour.scheme = c('lightyellow','gold','darkorange', 'darkorange3'),
at = seq(0,12,3),
colourkey.labels = seq(0,12,3),
colourkey.labels.at = seq(0,12,3),
bg.alpha = 0.65,
description = 'Dotmap created by BoutrosLab.plotting.general'
);
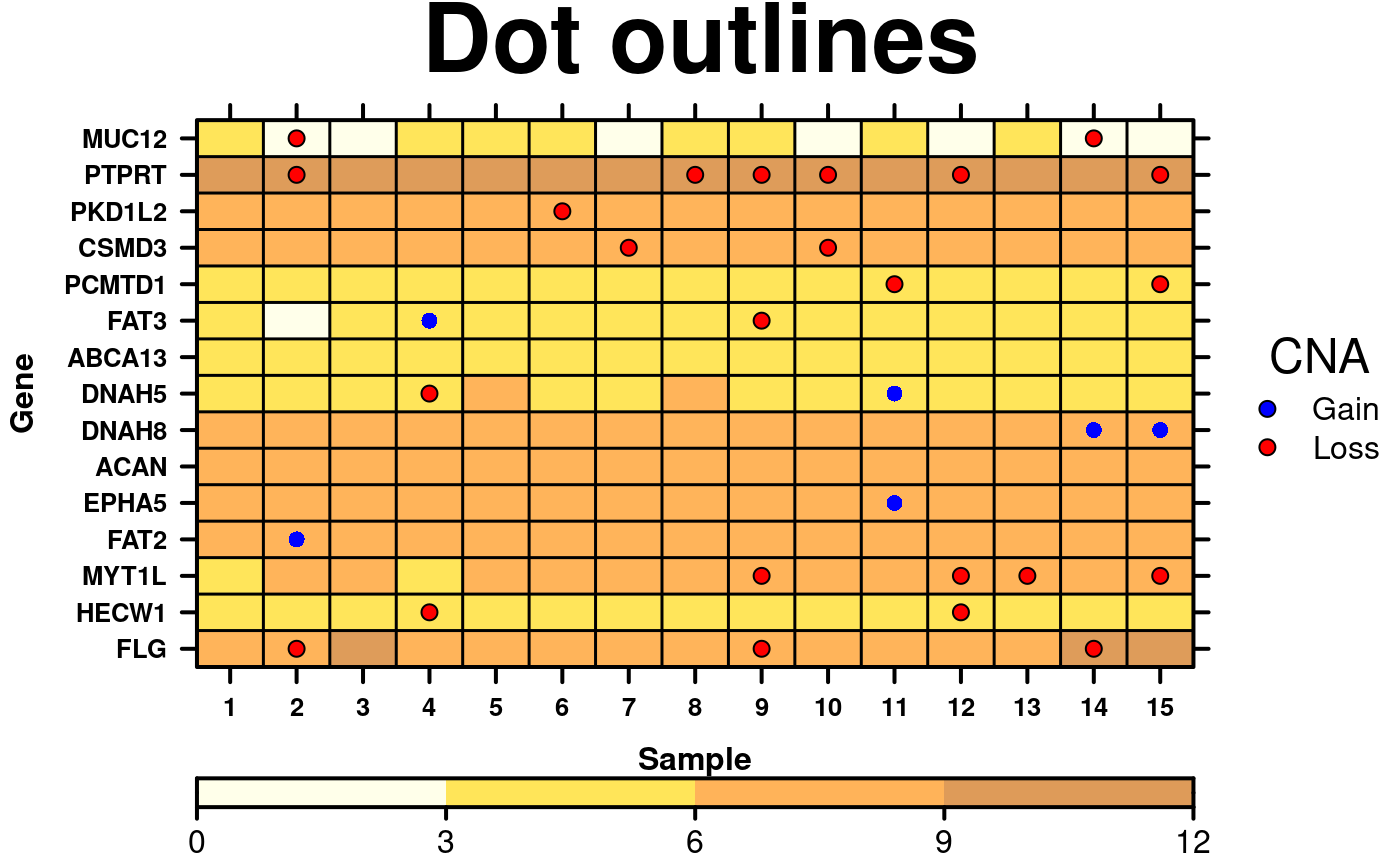
 # Dot outlines
border.colours <- function(x){
colours <- rep('transparent', length(x));
colours[x > 0] <- 'black';
colours[x == 0] <- 'transparent';
return(colours);
}
create.dotmap(
# filename = tempfile(pattern = 'Dotmap_Outlined_Dots', fileext = '.tiff'),
x = CNA[1:15,1:15],
bg.data = microarray[1:15,1:15],
main = 'Dot outlines',
spot.size.function = 1,
spot.colour.function = CNA.colour.function,
xaxis.cex = 0.8,
yaxis.cex = 0.8,
xaxis.lab = 1:15,
xlab.label = 'Sample',
ylab.label = 'Gene',
xlab.cex = 1,
ylab.cex = 1,
key = list(
space = 'right',
points = list(
cex = 1,
col = 'black',
# Remember to also change the pch in the legend
pch = 21,
fill = CNA.colour.function(key.sizes)
),
text = list(
lab = c('Gain', 'Loss'),
cex = 1,
adj = 1
),
title = 'CNA',
padding.text = 2,
background = 'white'
),
colourkey = TRUE,
key.top = 1,
colour.scheme = c('lightyellow','gold','darkorange', 'darkorange3'),
at = seq(0,12,3),
colourkey.labels = seq(0,12,3),
colourkey.labels.at = seq(0,12,3),
bg.alpha = 0.65,
# Change the plotting character to one which has an outline
pch = 21,
pch.border.col = border.colours(CNA[1:15,1:15]),
description = 'Dotmap created by BoutrosLab.plotting.general'
);
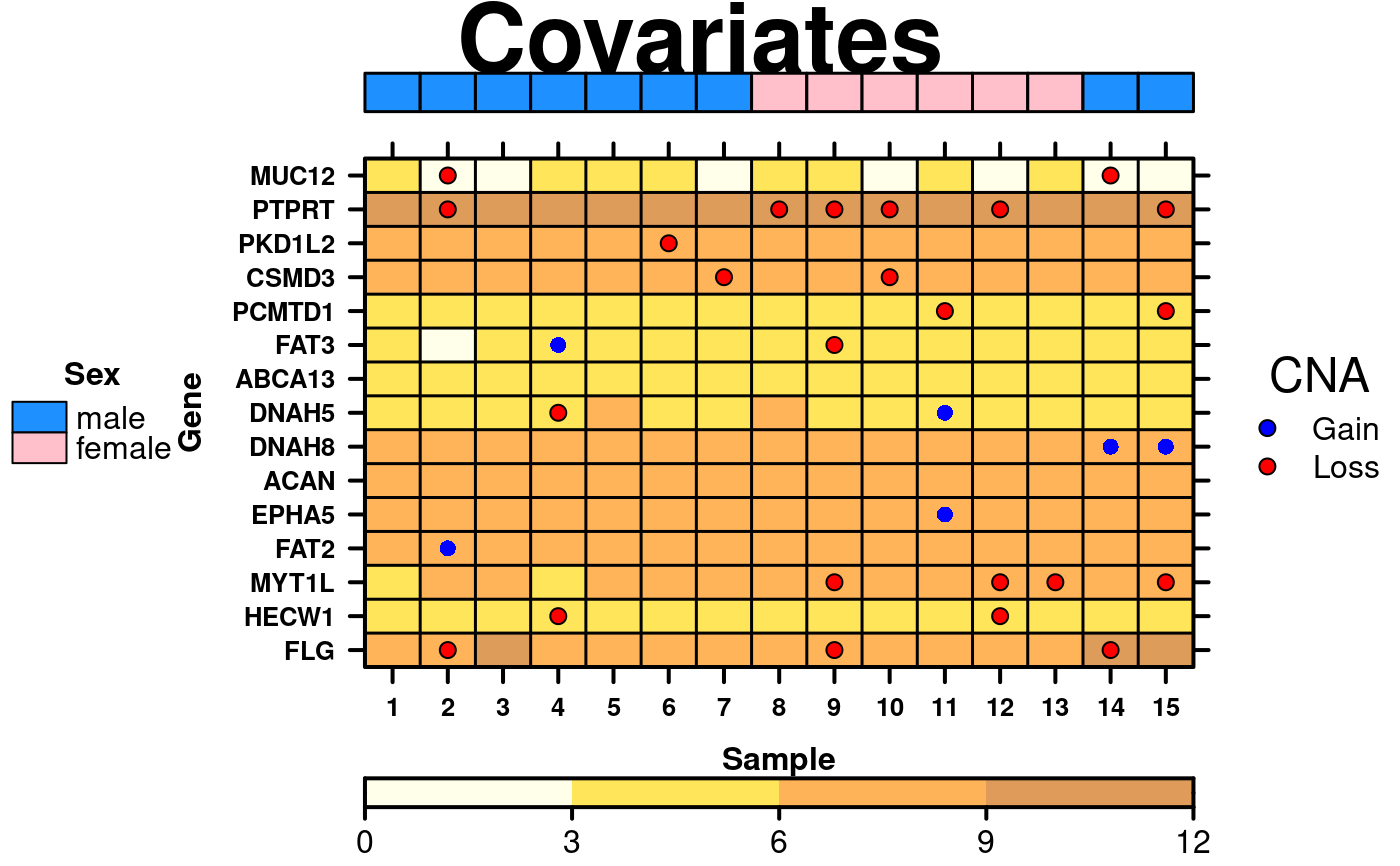
 # Covariates & Legend
sex.colours <- patient$sex[1:15];
sex.colours[sex.colours == 'male'] <- 'dodgerblue';
sex.colours[sex.colours == 'female'] <- 'pink';
sample.covariate <- list(
rect = list(
col = 'black',
fill = sex.colours,
lwd = 1.5
)
);
cov.grob <- covariates.grob(
covariates = sample.covariate,
ord = c(1:15),
side = 'top'
);
sample.cov.legend <- list(
legend = list(
colours = c('dodgerblue', 'pink'),
labels = c('male','female'),
title = 'Sex'
)
);
cov.legend <- legend.grob(
legends = sample.cov.legend
);
#> Warning: 'x' is NULL so the result will be NULL
create.dotmap(
# filename = tempfile(pattern = 'Dotmap_Covariates', fileext = '.tiff'),
x = CNA[1:15,1:15],
bg.data = microarray[1:15,1:15],
main = 'Covariates',
spot.size.function = 1,
spot.colour.function = CNA.colour.function,
xaxis.cex = 0.8,
yaxis.cex = 0.8,
xaxis.lab = 1:15,
xlab.label = 'Sample',
ylab.label = 'Gene',
xlab.cex = 1,
ylab.cex = 1,
key = list(
space = 'right',
points = list(
cex = 1,
col = 'black',
pch = 21,
fill = CNA.colour.function(key.sizes)
),
text = list(
lab = c('Gain', 'Loss'),
cex = 1,
adj = 1
),
title = 'CNA',
padding.text = 2,
background = 'white'
),
colourkey = TRUE,
key.top = 1,
colour.scheme = c('lightyellow','gold','darkorange', 'darkorange3'),
at = seq(0,12,3),
colourkey.labels = seq(0,12,3),
colourkey.labels.at = seq(0,12,3),
bg.alpha = 0.65,
pch = 21,
pch.border.col = border.colours(CNA[1:15,1:15]),
# Insert covariates & legend
legend = list(
top = list(
fun = cov.grob
),
left = list(
fun = cov.legend
)
),
description = 'Dotmap created by BoutrosLab.plotting.general'
);
 # Side covariates with label
chr.cov.colours <- microarray$Chr;
chr.cov.colours[microarray$Chr == 1] <- default.colours(3, palette.type = 'chromosomes')[1];
chr.cov.colours[microarray$Chr == 2] <- default.colours(3, palette.type = 'chromosomes')[2];
chr.cov.colours[microarray$Chr == 3] <- default.colours(3, palette.type = 'chromosomes')[3];
chr.covariate <- list(
rect = list(
col = 'white',
fill = chr.cov.colours,
lwd = 1.5
)
);
chr.cov.grob <- covariates.grob(
covariates = chr.covariate,
ord = c(1:15),
side = 'right'
);
# create dot legend
dot.grob <- draw.key(
list(
space = 'right',
points = list(
cex = 1,
col = 'black',
pch = 21,
fill = CNA.colour.function(key.sizes)
),
text = list(
lab = c('Gain', 'Loss'),
cex = 1,
adj = 1
),
title = 'CNA',
padding.text = 2,
background = 'white'
)
);
# Setting up the layout for the joint legends
right.layout <- grid.layout(
nrow = 1,
ncol = 2,
width = unit(
x = c(0,1),
units = rep('lines',2)
),
heights = unit(
x = c(1,1),
units = rep('npc', 1)
)
);
right.grob <- frameGrob(layout = right.layout);
right.grob <- packGrob(
frame = right.grob,
grob = chr.cov.grob,
row = 1,
col = 1
);
right.grob <- packGrob(
frame = right.grob,
grob = dot.grob,
row = 1,
col = 2
);
temp <- create.dotmap(
# filename = tempfile(pattern = 'Dotmap_Covariates_Side', fileext = '.tiff'),
x = CNA[1:15,1:15],
bg.data = microarray[1:15,1:15],
main = 'Both covariates',
spot.size.function = 1,
spot.colour.function = CNA.colour.function,
xaxis.cex = 0.8,
yaxis.cex = 0.8,
xaxis.lab = 1:15,
xlab.label = 'Sample',
ylab.label = 'Gene',
xlab.cex = 1,
ylab.cex = 1,
colourkey = TRUE,
key.top = 1,
colour.scheme = c('lightyellow','gold','darkorange', 'darkorange3'),
at = seq(0,12,3),
colourkey.labels = seq(0,12,3),
colourkey.labels.at = seq(0,12,3),
bg.alpha = 0.65,
pch = 21,
pch.border.col = border.colours(CNA[1:15,1:15]),
# insert covariates & legend
legend = list(
right = list(
fun = right.grob
)
),
description = 'Dotmap created by BoutrosLab.plotting.general'
);
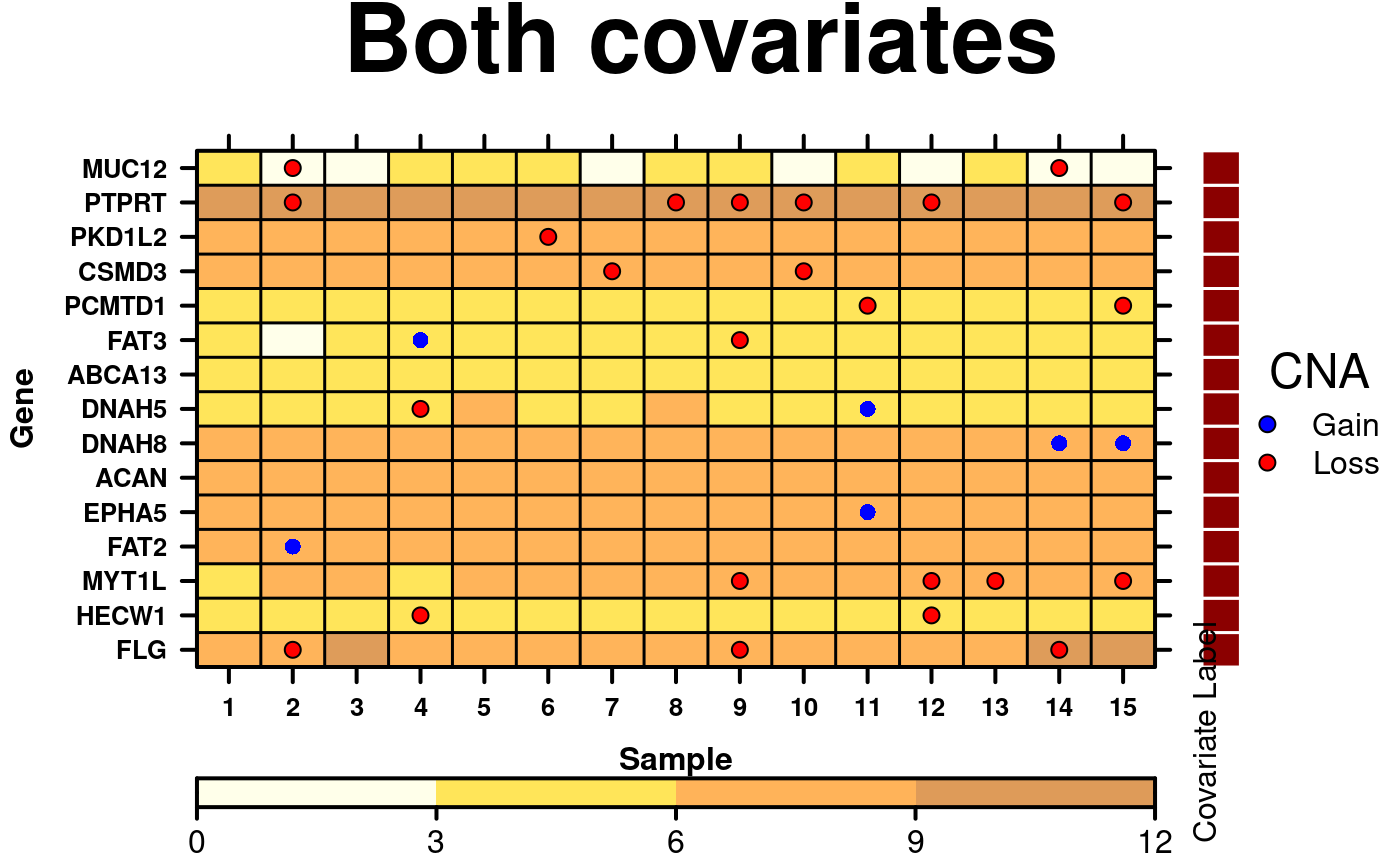
# add side label to covariate
print(temp, position = c(0,0,1,1), more = TRUE);
draw.key(
key = list(
text = list(
lab = 'Covariate Label',
cex = 1,
adj = 1
)
),
# position label on the plot
vp = viewport(x = 0.86, y = 0.155, height = 1, width = 0.5, angle = 90),
draw = TRUE
);
 #> latticeKey[plot_01.key.frame]
dev.off();
#> null device
#> 1
# Nature style
create.dotmap(
# filename = tempfile(pattern = 'Dotmap_Nature_style', fileext = '.tiff'),
x = CNA[1:15,1:15],
bg.data = microarray[1:15,1:15],
main = 'Nature style',
spot.size.function = 1,
spot.colour.function = CNA.colour.function,
xaxis.cex = 0.8,
yaxis.cex = 0.8,
xaxis.lab = 1:15,
xlab.cex = 1,
ylab.cex = 1,
key = list(
space = 'right',
points = list(
cex = 1,
col = 'black',
# Remember to also change the pch in the legend
pch = 21,
fill = CNA.colour.function(key.sizes)
),
text = list(
lab = c('Gain', 'Loss'),
cex = 1,
adj = 1
),
title = 'CNA',
padding.text = 2,
background = 'white'
),
colourkey = TRUE,
key.top = 1,
colour.scheme = c('lightyellow','gold','darkorange', 'darkorange3'),
at = seq(0,12,3),
colourkey.labels = seq(0,12,3),
colourkey.labels.at = seq(0,12,3),
bg.alpha = 0.65,
# Change the plotting character to one which has an outline
pch = 21,
pch.border.col = border.colours(CNA[1:15,1:15]),
# set style to Nature
style = 'Nature',
# demonstrating how to italicize character variables
ylab.lab = expression(paste('italicized ', italic('a'))),
# demonstrating how to create en-dashes
xlab.lab = expression(paste('en dashs: 1','\u2013', '10'^'\u2013', ''^3)),
resolution = 200
);
#> Warning: Setting resolution to 1200 dpi.
#> Warning: Nature also requires italicized single-letter variables and en-dashes
#> for ranges and negatives. See example in documentation for how to do this.
#> Warning: Avoid red-green colour schemes, create TIFF files, do not outline the figure or legend
simple.data.sym <- data.frame(
'1' = runif(n = 7, min = -1, max = 1),
'2' = runif(n = 7, min = -1, max = 1),
'3' = runif(n = 7, min = -1, max = 1),
'4' = runif(n = 7, min = -1, max = 1),
'5' = runif(n = 7, min = -1, max = 1),
'6' = runif(n = 7, min = -1, max = 1),
'7' = runif(n = 7, min = -1, max = 1)
);
create.dotmap(
# filename = tempfile(pattern = 'Dotmap_remove_symmetric', fileext = '.tiff'),
x = simple.data.sym,
main = 'Simple',
xaxis.lab = seq(1,7,1),
description = 'Dotmap created by BoutrosLab.plotting.general',
remove.symmetric = TRUE,
resolution = 200
);
# }