Make a heatmap
create.heatmap.RdTakes a data.frame and creates a heatmap
Usage
create.heatmap(
  x,
  filename = NULL,
  clustering.method = 'diana',
  cluster.dimensions = 'both',
  rows.distance.method = 'correlation',
  cols.distance.method = 'correlation',
  cor.method = 'pearson',
  row.dendrogram = list(),
  col.dendrogram = list(),
  plot.dendrograms = 'both',
  force.clustering = FALSE,
  criteria.list = TRUE,
  covariates = list(),
  covariates.grid.row = NULL,
  covariates.grid.col = NULL,
  covariates.grid.border = NULL,
  covariates.row.lines = NULL,
  covariates.col.lines = NULL,
  covariates.reorder.grid.index = FALSE,
  covariates.padding = 0.25,
  covariates.top = list(),
  covariates.top.grid.row = NULL,
  covariates.top.grid.col = NULL,
  covariates.top.grid.border = NULL,
  covariates.top.row.lines = NULL,
  covariates.top.col.lines = NULL,
  covariates.top.reorder.grid.index = FALSE,
  covariates.top.padding = 0.25,
  covariate.legends = list(),
  legend.cex = 1,
  legend.title.cex = 1,
  legend.title.just = 'centre',
  legend.title.fontface = 'bold',
  legend.border = NULL,
  legend.border.padding = 1,
  legend.layout = NULL,
  legend.between.col = 1,
  legend.between.row = 1,
  legend.side = 'left',
  main = list(label = ''),
  main.just = "center",
  main.x = 0.5,
  main.y = 0.5,
  main.cex = 3,
  right.size.add = 1,
  top.size.add = 1,
  right.dendrogram.size = 2.5,
  top.dendrogram.size = 2.5,
  scale.data = FALSE,
  yaxis.lab = NULL,
  xaxis.lab = NULL,
  xaxis.lab.top = NULL,
  xaxis.cex = 1.5,
  xaxis.top.cex = NULL,
  yaxis.cex = 1.5,
  xlab.cex = 2,
  ylab.cex = 2,
  xlab.top.label = NULL,
        xlab.top.cex = 2,
  xlab.top.col = 'black',
  xlab.top.just = "center",
  xlab.top.x = 0.5,
  xlab.top.y = 0,
  xat = TRUE,
  xat.top = NULL,
  yat = TRUE,
  xaxis.tck = NULL,
  xaxis.top.tck = NULL,
  yaxis.tck = NULL,
  xaxis.col = 'black',
  yaxis.col = 'black',
  col.pos = NULL,
  row.pos = NULL,
  cell.text = '',
  text.fontface = 1,
  text.cex = 1,
  text.col = 'black',
  text.position = NULL,
  text.offset = 0,
  text.use.grid.coordinates = TRUE,
  colourkey.cex = 3.6,
  xaxis.rot = 90,
  xaxis.rot.top = 90,
  yaxis.rot = 0,
  xlab.label = '' ,
  ylab.label = '',
  xlab.col = 'black',
  ylab.col = 'black',
  axes.lwd = 2,
  gridline.order = 'h',
  grid.row = FALSE,
  grid.col = FALSE,
  force.grid.row = FALSE,
  force.grid.col = FALSE,
  grid.limit = 50,
  row.lines = seq(0, ncol(x), 1) + 0.5,
  col.lines = seq(0, nrow(x), 1) + 0.5,
  colour.scheme = c(),
  total.colours = 99,
  colour.centering.value = 0,
  colour.alpha = 1,
  fill.colour = 'darkgray',
  at = NULL,
  print.colour.key = TRUE,
  colourkey.labels.at = NULL,
  colourkey.labels = NULL,
  top.padding = 0.1,
  bottom.padding = 0.5,
  right.padding = 0.5,
  left.padding = 0.5,
  x.alternating = 1,
  shrink = 1,
  row.colour = 'black',
  col.colour = 'black',
  row.lwd = 1,
  col.lwd = 1,
  grid.colour = NULL,
  grid.lwd = NULL,
  width = 6,
  height = 6,
  size.units = 'in',
  resolution = 1600,
  enable.warnings = FALSE,
  xaxis.covariates = NULL,
  xaxis.covariates.y = 0,
  yaxis.covariates = NULL,
  yaxis.covariates.x = NULL,
  description = 'Created with BoutrosLab.plotting.general',
  xaxis.fontface = 'bold',
  yaxis.fontface = 'bold',
  symbols = list(borders = NULL,
  squares = NULL,
  circles = NULL),
  same.as.matrix = FALSE,
  input.colours = FALSE,
  axis.xlab.padding = 0.1,
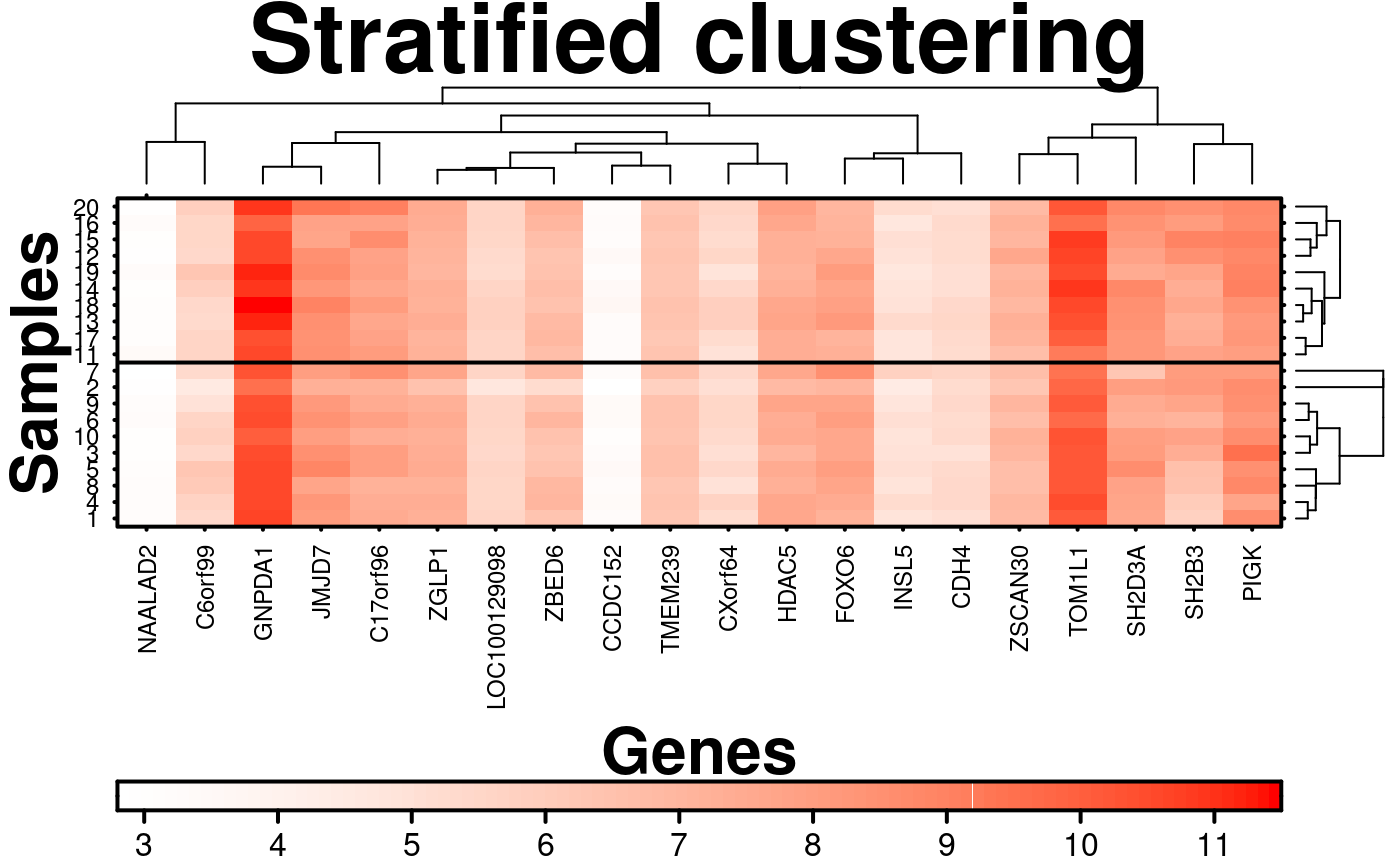
  stratified.clusters.rows = NULL,
  stratified.clusters.cols = NULL,
        inside.legend = NULL,
  style = 'BoutrosLab',
  preload.default = 'custom',
        use.legacy.settings = FALSE
);
Arguments
- x
Either a data-frame or a matrix from which the heatmap is to created
- filename
Filename for tiff output, or if NULL returns the trellis object itself
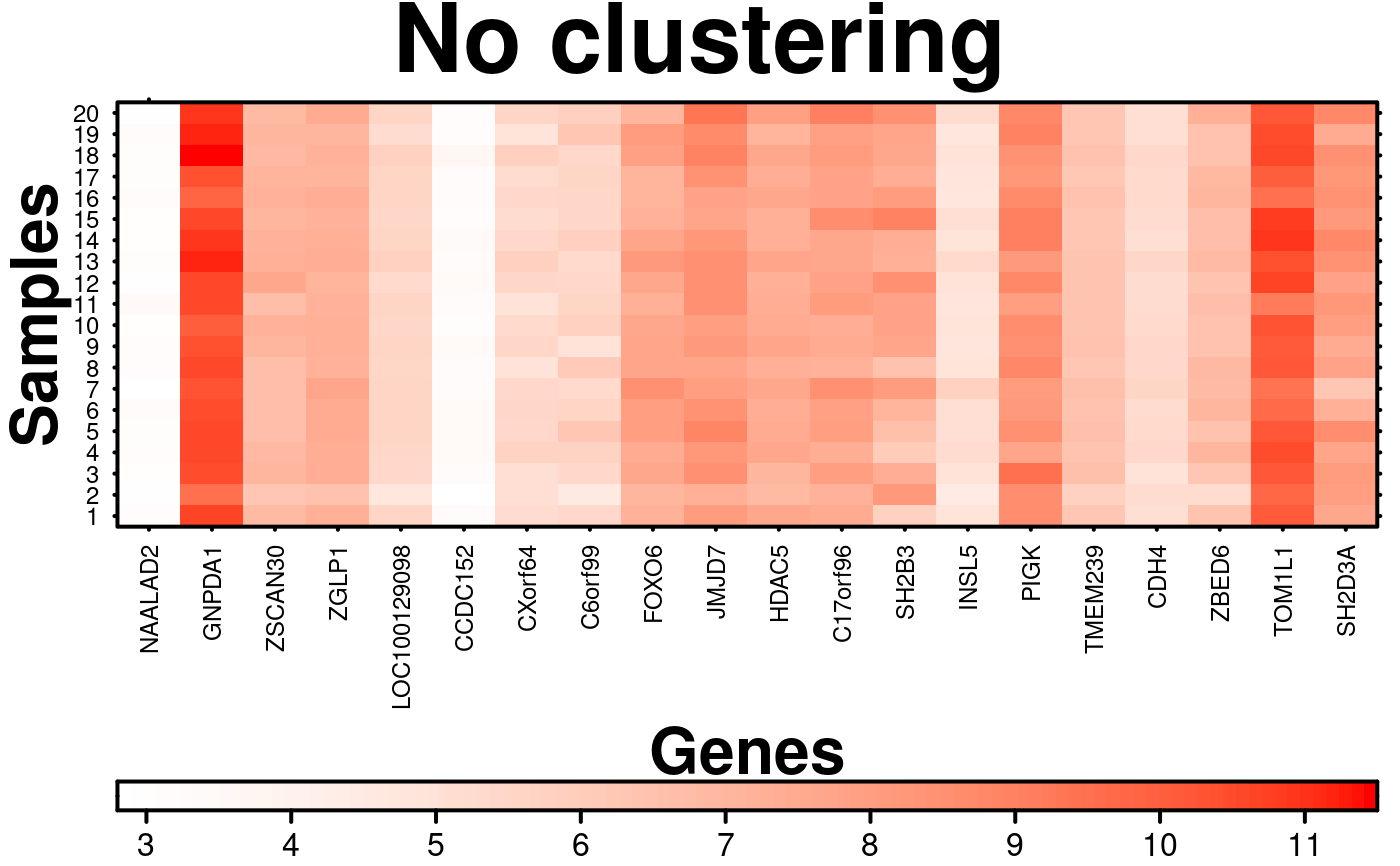
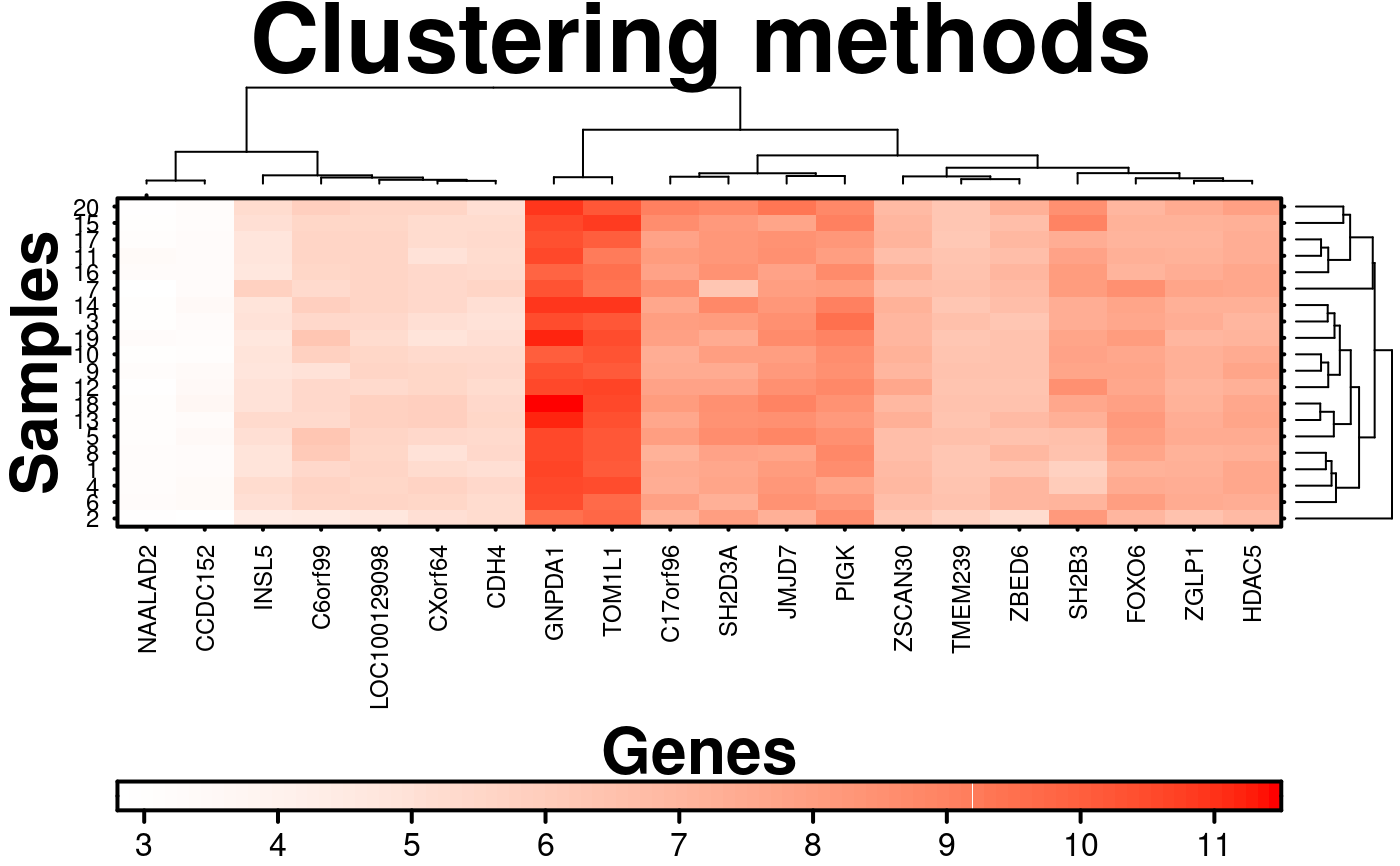
- clustering.method
Method used to cluster the records – “none” gives unclustered data. Accepts all agglomerative clustering methods available in hclust, plus “diana” (which is divisive).
- cluster.dimensions
Should clustering be performed on rows, columns, or both – supersedes setting of plot.dendrograms
- rows.distance.method
Method name of the distance measure between rows to be used for clustering. Defaults to “correlation”. Other supported methods are same as in ?dist. Also supports “jaccard” which is useful for clustering categorical variables. “euclidean” is sometimes more robust when ties cause “Unclusterable matrix: some col-distances are null” errors. Note, rows and cols are switched due an internal transposition of the data.
- cols.distance.method
Method name of the distance measure between columns to be used for clustering. Defaults to “correlation”. Other supported methods are same as in ?dist. Also supports “jaccard” which is useful for clustering categorical variables. “euclidean” is sometimes more robust when ties cause “Unclusterable matrix: some col-distances are null” errors. Note, rows and cols are switched due an internal transposition of the data.
- cor.method
The method used for calculating correlation. Defaults to “pearson”
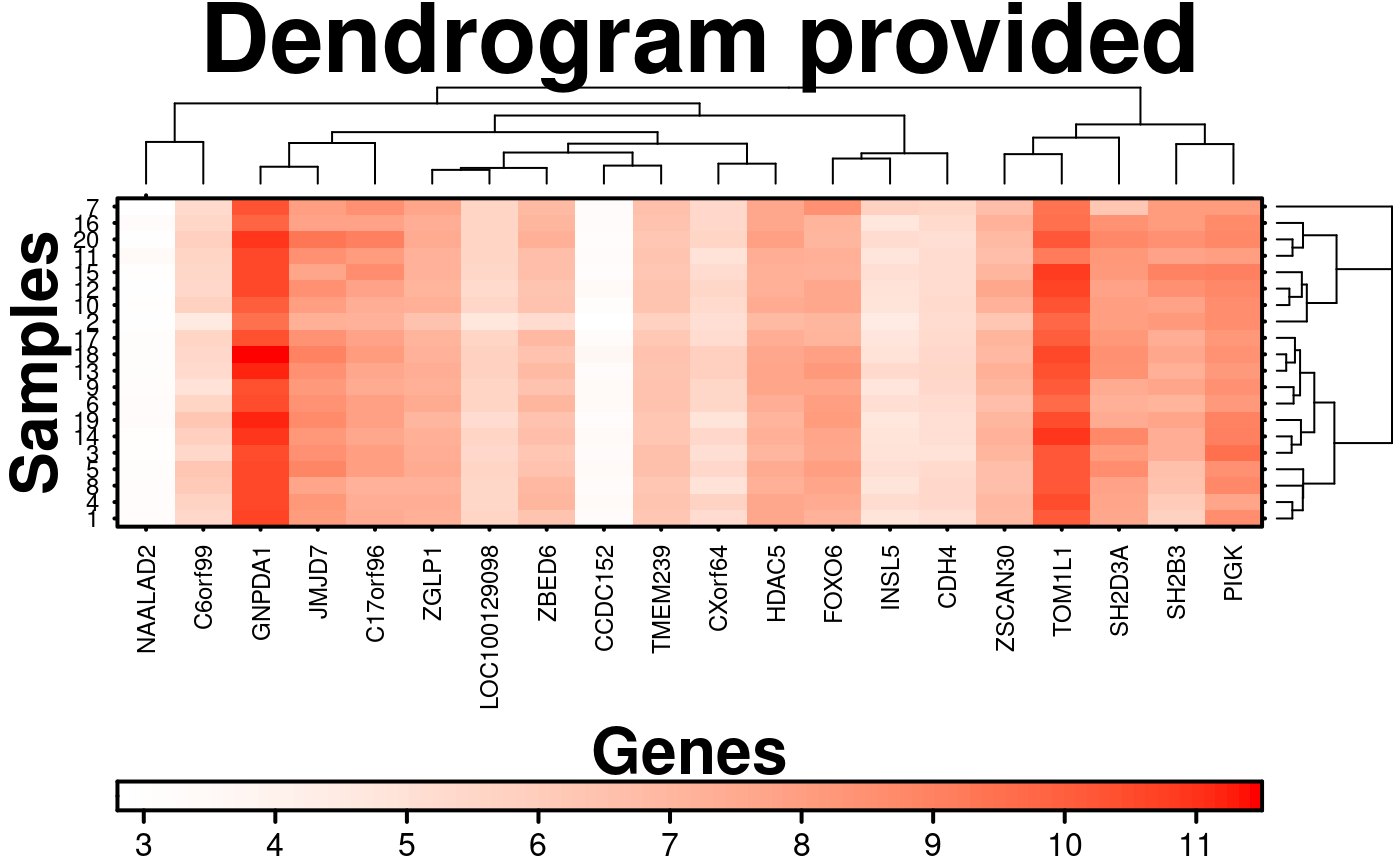
- row.dendrogram
A dendrogram object corresponding to the heatmap rows. If provided, row clustering cannot be performed
- col.dendrogram
A dendrogram object corresponding to the heatmap columns. If provided, column clustering cannot be performed
- plot.dendrograms
If clustering is performed or dendrograms are provided, which dendrograms should be plotted – “none”, “right”, “top”, or “both”
- force.clustering
Binary to over-ride the control that prevents clustering of too-large matrices
- criteria.list
A vector indicating which rows should be retained
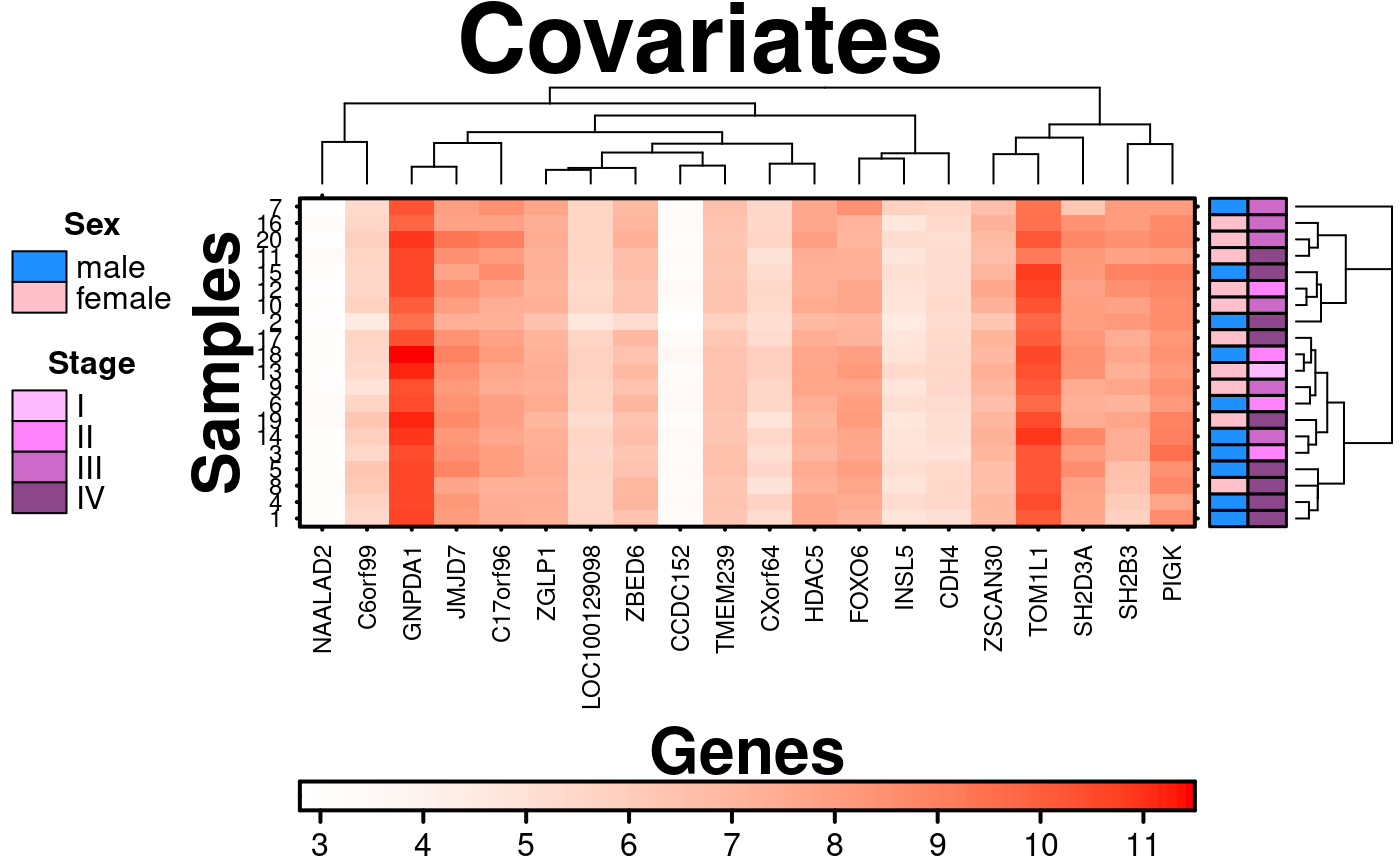
- covariates
Any row-wise covariate annotate to add to the plot, as a fully formed list (placed on right side of plot)
- covariates.grid.row
A list of parameters passed to
gparspecifying the behaviour of row lines in the right covariate bars- covariates.grid.col
A list of parameters passed to
gparspecifying the behaviour of column lines in the right covariate bars- covariates.grid.border
A list of parameters passed to
gparspecifying the behaviour of the border around the right covariate bars- covariates.row.lines
Vector of row indices where grid lines should be drawn on the right covariate bars. If NULL (default), all row lines are drawn. Ignored if
covariates.grid.rowis not specified- covariates.col.lines
Vector of column indices where grid lines should be drawn on the right covariate bars. If NULL (default), all column lines are drawn. Ignored if
covariates.grid.colis not specified- covariates.reorder.grid.index
Boolean specifying whether grid line indices for the right covariate bars should be re-ordered with clustering
- covariates.padding
Amount of empty space (in “lines”) to place between the right covariate bars and dendrogram
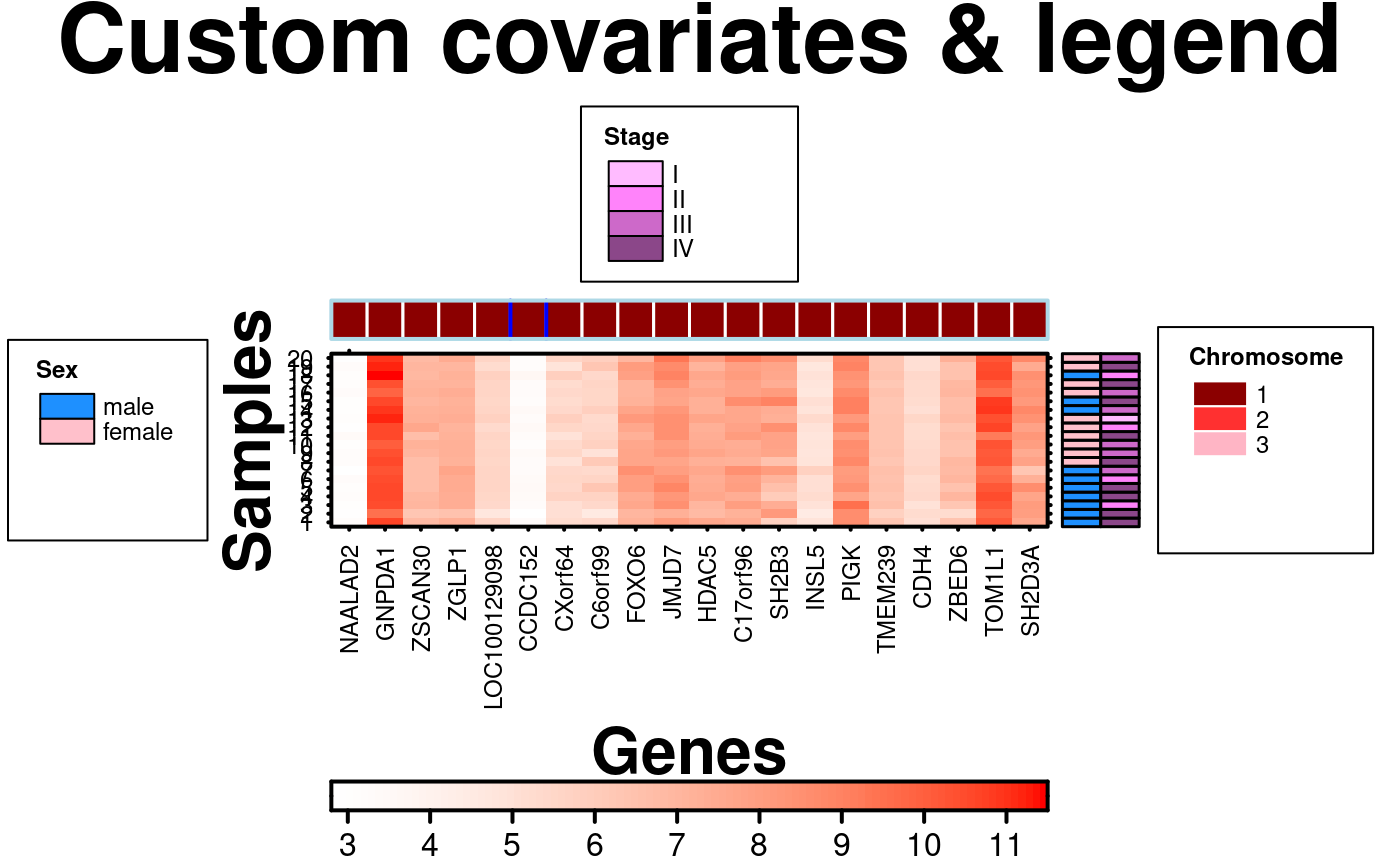
- covariates.top
Any column-wise covariate annotate to add to the plot, as a fully formed list
- covariates.top.grid.row
A list of parameters passed to
gparspecifying the behaviour of row lines in the top covariate bars- covariates.top.grid.col
A list of parameters passed to
gparspecifying the behaviour of column lines in the top covariate bars- covariates.top.grid.border
A list of parameters passed to
gparspecifying the behaviour of the border around the top covariate bars- covariates.top.row.lines
Vector of row indices where grid lines should be drawn on the top covariate bars. If NULL (default), all row lines are drawn. Ignored if
covariates.top.grid.rowis not specified- covariates.top.col.lines
Vector of column indices where grid lines should be drawn on the top covariate bars. If NULL (default), all column lines are drawn. Ignored if
covariates.top.grid.colis not specified- covariates.top.reorder.grid.index
Boolean specifying whether grid line indices for the top covariate bars should be re-ordered with clustering
- covariates.top.padding
Amount of empty space (in “lines”) to place between the top covariate bars and dendrogram
- covariate.legends
A list defining covariate legends to add to the plot. See
legendsargument oflegend.grobfor more information- legend.cex
Size of text labels in covariate legends, defaults to 1
- legend.title.cex
Size of title text in covariate legends, defaults to 1
- legend.title.just
Justification of title text in covariate legends, defaults to “centre”
- legend.title.fontface
Font face of title text in covariate legends – “plain”, “bold”, “italic”, etc.
- legend.border
A list of parameters passed to
gparspecifying line options for the legend border, defaults to NULL (no border drawn)- legend.border.padding
The amount of empty space (split equally on both sides) to add between the legend and its border, in “lines” units
- legend.layout
Numeric vector of length 2 specifying the number of columns and rows for the legend layout, defaults to a logical layout based on
legend.side- legend.between.col
Amount of space to add between columns in the layout, in “lines” units
- legend.between.row
Amount of space to add between rows in the layout, in “lines” units
- legend.side
Side of the plot where the legends should be drawn – “left”, “right”, or “top”
- main
The main title for the plot (space is reclaimed if NULL)
- main.just
The justification of the main title for the plot, default is centered
- main.x
The x location of the main title, deault is 0.5
- main.y
The y location of the main title, default is 0.5
- main.cex
Size of text for main plot title, defaults to 2.5
- right.size.add
The size of each extra covariate row in the right dendrogram in units of “lines”
- top.size.add
The size of each extra covariate row in the top dendrogram in units of “lines”
- right.dendrogram.size
Size of right dendrogram
- top.dendrogram.size
Size of top dendrogram
- scale.data
TRUE/FALSE to do row-wise scaling with mean-centering and sd-scaling
- xaxis.lab
A vector of row labels, NA = use existing rownames, NULL = none
- xaxis.lab.top
The label for the top x-axis. Required only if you want to print a top *and* bottom xaxis, otherwise use x.alternating = 2 for top axis only. Defaults to NULL
- yaxis.lab
A vector of col labels, NA = use existing colnames, NULL = none
- xaxis.cex
Size of x-axis label text - defaults to values found in a look-up table
- xaxis.top.cex
Size of top x axis label text
- yaxis.cex
Size of y-axis label text - defaults to values found in a look-up table
- xaxis.rot
Rotation of x-axis tick labels; defaults to 90
- xaxis.rot.top
Rotation of the top x-axis tick labels; defaults to 90
- yaxis.rot
Rotation of y-axis tick labels; defaults to 0
- xaxis.col
Colour of the x-axis tick labels, defaults to “black”
- yaxis.col
Colour of the y-axis tick labels, defaults to “black”
- xlab.label
The label for the x-axis
- ylab.label
The label for the y-axis
- xlab.cex
Size of x-axis label, defaults to 2
- ylab.cex
Size of y-axis label, defaults to 2
- xlab.col
Colour of the x-axis label, defaults to “black”
- ylab.col
Colour of the y-axis label, defaults to “black”
- xlab.top.label
The label for the top x-axis
- xlab.top.cex
Size of top x-axis label
- xlab.top.col
Colour of the top x-axis label
- xlab.top.just
Justification of the top x-axis label, defaults to centered
- xlab.top.x
The x location of the top x-axis label
- xlab.top.y
The y location of the top y-axis label
- xat
Vector listing where the x-axis labels should be drawn, defaults to automatic
- xat.top
Vector listing where the x-axis labels should be drawn on the top of the plot. Required only when you want bottom and top axis, otherwise use x.alternating = 2, to get top axis only. Defaults to NULL
- yat
Vector listing where the y-axis labels should be drawn, defaults to automatic
- xaxis.tck
Size of x-axis tick marks. Defaults to NULL for intelligent choice based on covariate size.
- xaxis.top.tck
Size of top x-axis tick marks. Defaults to NULL for intelligent choice based on covariate size.
- yaxis.tck
Size of y-axis tick marks. Defaults to NULL for intelligent choice based on covariate size.
- col.pos
Vector of column positions for adding text to cell, defaults to NULL
- row.pos
Vector of row positions for adding text to cell, defaults to NULL
- cell.text
Text to add to cell, defaults to an empty string
- text.fontface
1 = Plain, 2 = Bold, 3 = Italic, default is 1
- text.cex
Text size, default is 1
- text.col
Text colour, default is black.
- text.position
The position of the text, defaults to center.
- text.offset
The offset of the position, defaults to 0.
- text.use.grid.coordinates
Indetifier if grid coordinates or npc coordinates should be used
- colourkey.cex
Size of colourkey label text
- axes.lwd
Width of heatmap border. Note it also changes the colourkey border and ticks
- gridline.order
Character specifying order in which to draw interior grid-lines ('h' or 'v'). Defaults to 'h' for horizontal first.
- grid.row
Allow turning off of the interior grid-lines. Default FALSE
- grid.col
Allow turning off of the interior grid-lines. Default FALSE
- force.grid.row
Overrides default behaviour of turning off grid lines when number of rows exceed grid.limit. Defaults to FALSE
- force.grid.col
Overrides default behaviour of turning off grid lines when number of columns exceed grid.limit. Defaults to FALSE
- grid.limit
Limit set for when to turn off column and row lines if data size exceeds it. Defaults to 50
- row.lines
Vector specifying location of lines, default is seq(1, ncol(x), 1) + 0.5. Note: Add 0.5 to customized vector
- col.lines
Vector specifying location of lines, default is seq(1, nrow(x), 1) + 0.5. Note: Add 0.5 to customized vector
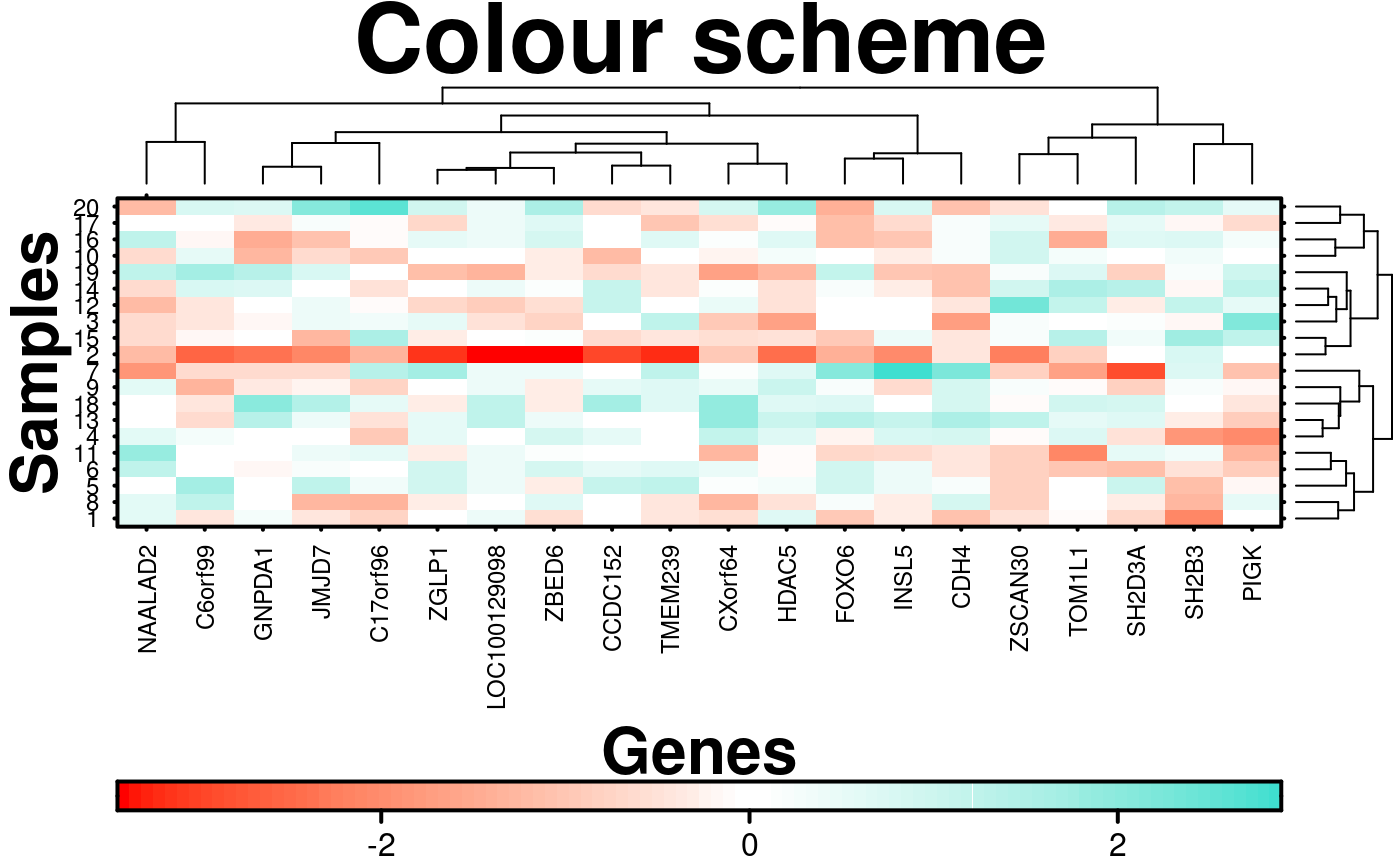
- colour.scheme
Heatmap colouring. Accepts old-style themes, or a vector of either two or three colours that are gradiated to create the final palette.
- total.colours
Total number of colours to plot
- colour.centering.value
What should be the center of the colour-map
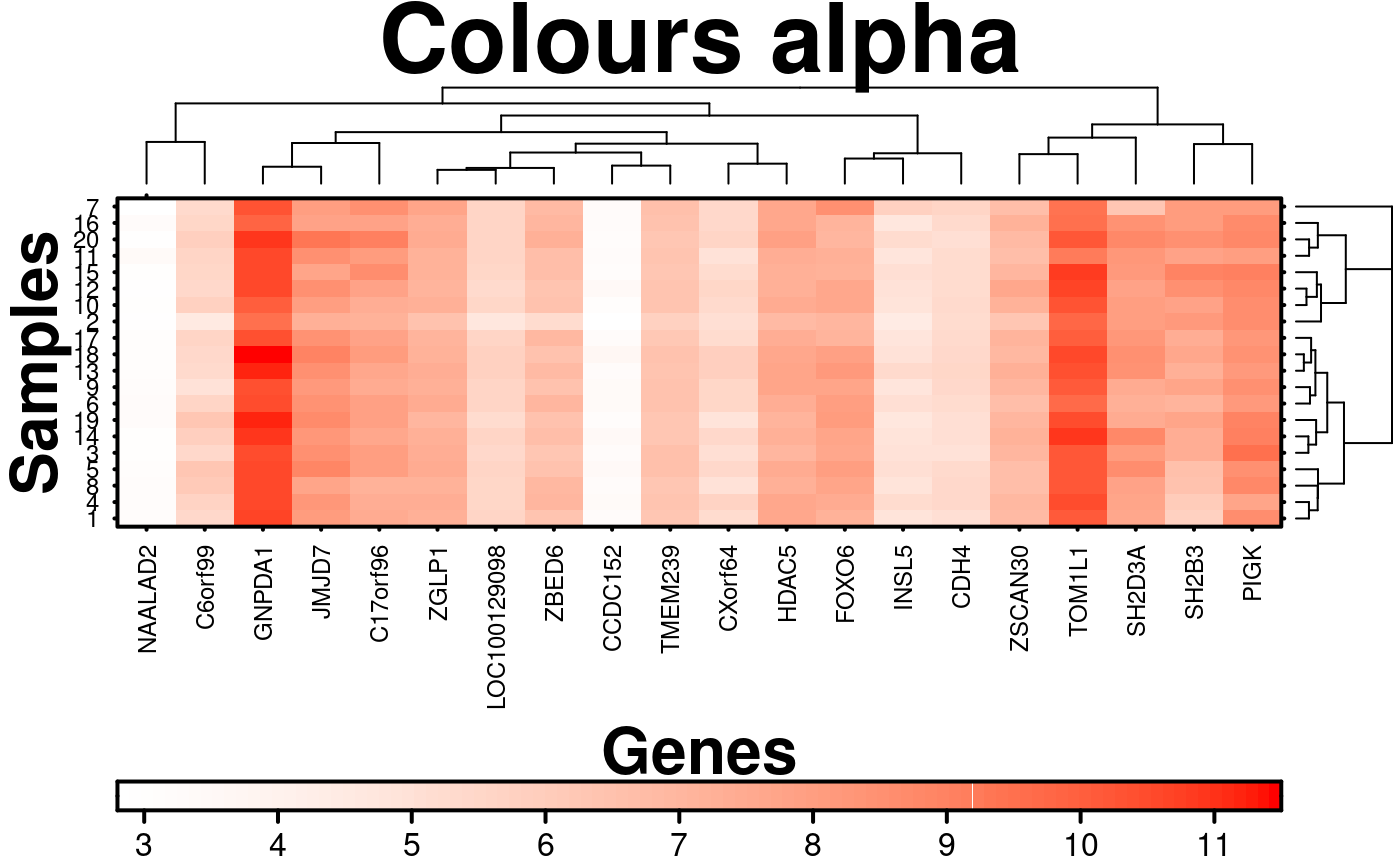
- colour.alpha
Bias to be added to colour selection (uses x^colour.alpha in mapping). Set to “automatic” for auto-adjustment.
- fill.colour
The background fill (only exposed where missing values are present
- print.colour.key
Should the colour key be printed at all?
- at
A vector specifying the breakpoints along the range of x; each interval specified by these breakpoints are assigned to a colour from the palette. Defaults to NULL, which corresponds to the range of x being divided into total.colours equally spaced intervals. If x has values outside of the range specified by “at” those values are shown with the colours corresponding to the extreme ends of the colour spectrum and a warning is given.
- colourkey.labels.at
A vector specifying the tick-positions on the colourkey
- colourkey.labels
A vector specifying tick-labels of the colourkey
- top.padding
A number specifying the distance to the top margin, defaults to 0.1
- bottom.padding
A number specifying the distance to the bottom margin, defaults to 0.5
- right.padding
A number specifying the distance to the right margin, defaults to 0.5
- left.padding
A number specifying the distance to the left margin, defaults to 0.5
- x.alternating
A value specifying the position of the col names, defaults to 1. 1 means below the graph, 2 means above the graph. Use 3 to get tick marks below and above graph, but still need to specify xat.top and xaxis.lab.top to get values there
- shrink
Allows rectangles to be scaled, defaults to 1
- row.colour
Interior grid-line colour, defaults to “black”. Can be a vector
- col.colour
Interior grid-line colour, defaults to “black”. Can be a vector
- row.lwd
Interior grid-line width, defaults to 1. Setting to zero is equivalent to grid.row = FALSE and grid.col = FALSE. Can be a vector.
- col.lwd
Interior grid-line width, defaults to 1. Setting to zero is equivalent to grid.row = FALSE and grid.col = FALSE. Can be a vector.
- grid.colour
Interior grid-line colour, defaults to “black”. Can be a vector. Applies to both rows and columns. DEPRECATED
- grid.lwd
Interior grid-line width, defaults to 1. Setting to zero is equivalent to grid.row = FALSE and grid.col = FALSE. Applies to both rows and columns. DEPRECATED
- width
Figure width in size.units
- height
Figure height in size.units
- size.units
Units of size for the figure
- resolution
Figure resolution in dpi
- enable.warnings
Print warnings if set to TRUE, defaults to FALSE
- xaxis.covariates
Any column-wise covariate annotate to add to the plot, as a fully formed list
- xaxis.covariates.y
The y coordinate of the location of the x axis covariates
- yaxis.covariates
Any row-wise covariate annotate to add to the plot, as a fully formed list
- yaxis.covariates.x
The x coordinate of the lcoation of the y axis covariates
- description
Short description of image/plot; default NULL.
- xaxis.fontface
Fontface for the x-axis scales
- yaxis.fontface
Fontface for the y-axis scales
- symbols
Extra symbols to be added (borders, squares and circles)
- same.as.matrix
Prevents the flipping of the matrix that the function normally does
- input.colours
boolean expressing whether or not the matrix was specified using colours or integer values. Defaults to FALSE
- axis.xlab.padding
Padding between axis of plot and x label
- stratified.clusters.rows
the row locations of the rows to be combined into a strata
- stratified.clusters.cols
the column locations of the columns to be combined into a strata
- inside.legend
legend specification for the inside legend/key of the heatmap
- style
defaults to “BoutrosLab”, also accepts “Nature”, which changes parameters according to Nature formatting requirements
- preload.default
ability to set multiple sets of diffrent defaults depending on publication needs
- use.legacy.settings
boolean to set wheter or not to use legacy mode settings (font)
Value
If filename is NULL then returns the trellis object, otherwise creates a plot and returns a 0/1 success code.
Warning
If this function is called without capturing the return value, or specifying a filename, it may crash while trying to draw the heatmap. In particular, if a script that uses such a call of create heatmap is called by reading the script in from the command line, it will fail badly, with an error message about unavailable fonts:
    Error in grid.Call.graphics("L_text", as.graphicsAnnot(x$label), x$x,  )
        Invalid font type
    Calls: print ... drawDetails.text -> grid.Call.graphics -> .Call.graphics
Note that we would very much like to be able to pass xaxis.cex and yaxis.cex as vectors of the same length as the actual data-table. However lattice does not support that, because it currently expects them as a two-element vectors to specify left/right or top/bottom axes separately. I've raised a bug report on requesting an enhancement, but this would require an API change so... not sure if it will happen. Here's the bug-report:
https://r-forge.r-project.org/tracker/index.php?func=detail&aid=1702&group_id=638&atid=2567
Examples
set.seed(12345);
simple.data <- data.frame(
x <- rnorm(n = 15),
y <- rnorm(n = 15),
z <- rnorm(n = 15),
v <- rnorm(n = 15),
w <- rnorm(n = 15)
);
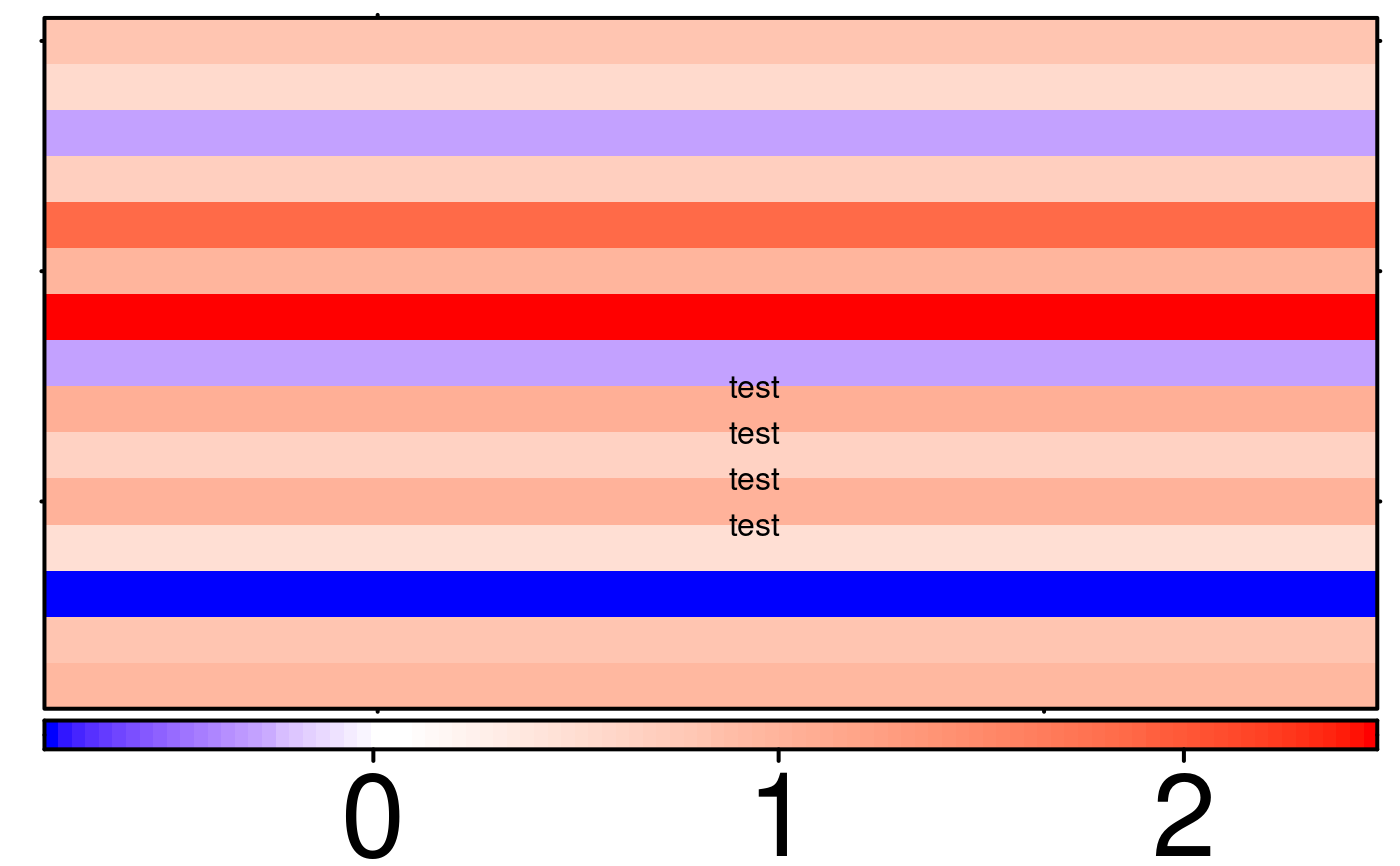
simple.1D.data <- data.frame(x = rnorm(n = 15));
create.heatmap(
# filename = tempfile(pattern = 'Heatmap_1D_Inside_Legend', fileext = '.tiff'),
x = simple.1D.data,
clustering.method='none',
inside.legend = list(fun = draw.key,
args = list(
key = list(
text = list(
lab = c('test','test','test','test'),
cex = 1,
fontface = 'bold'
),
padding.text = 3,
background = 'white',
alpha.background = 0
)
),
x = 0.5,
y = 0.5
),
resolution = 100
)
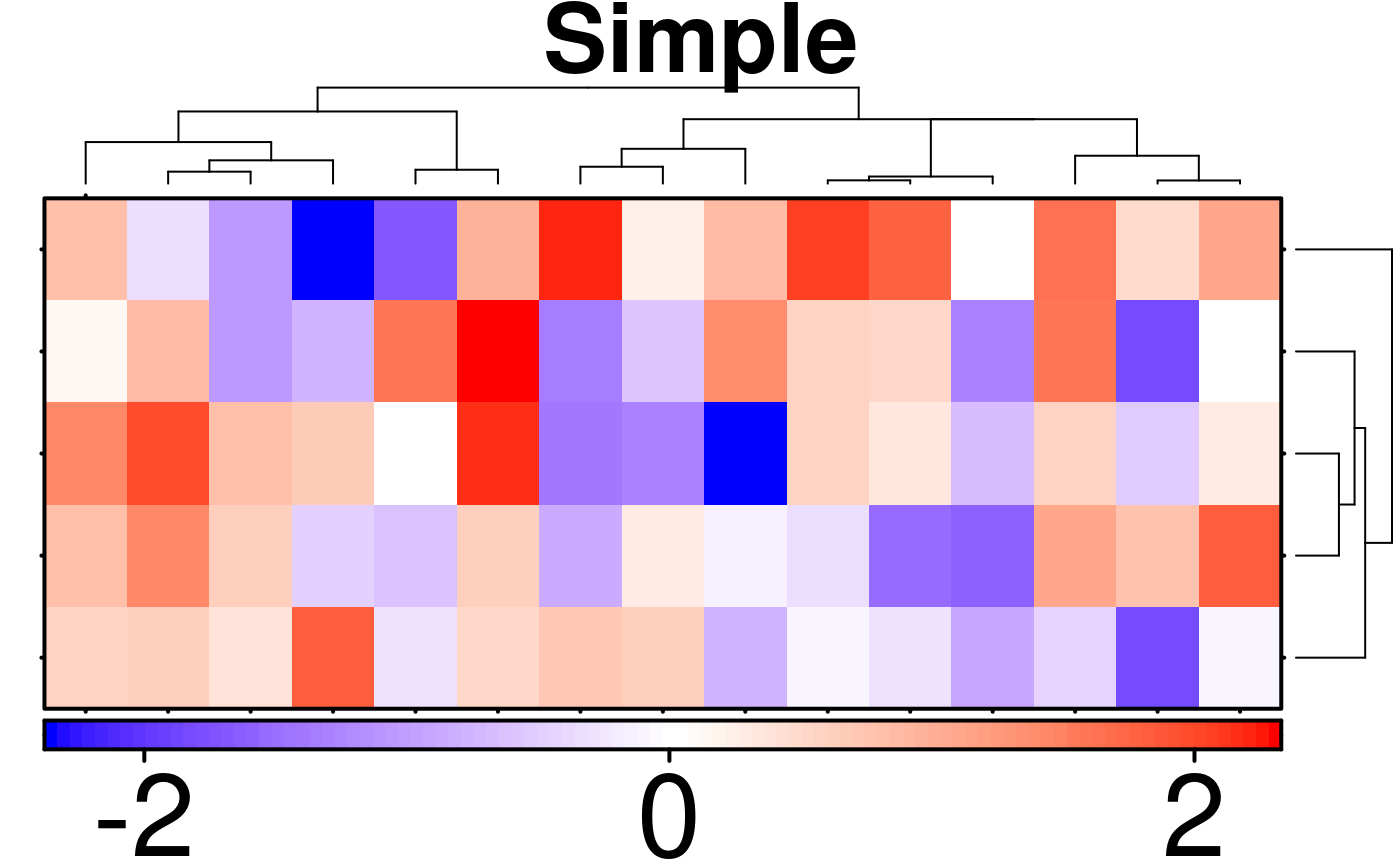
 create.heatmap(
# filename = tempfile(pattern = 'Heatmap_Simple', fileext = '.tiff'),
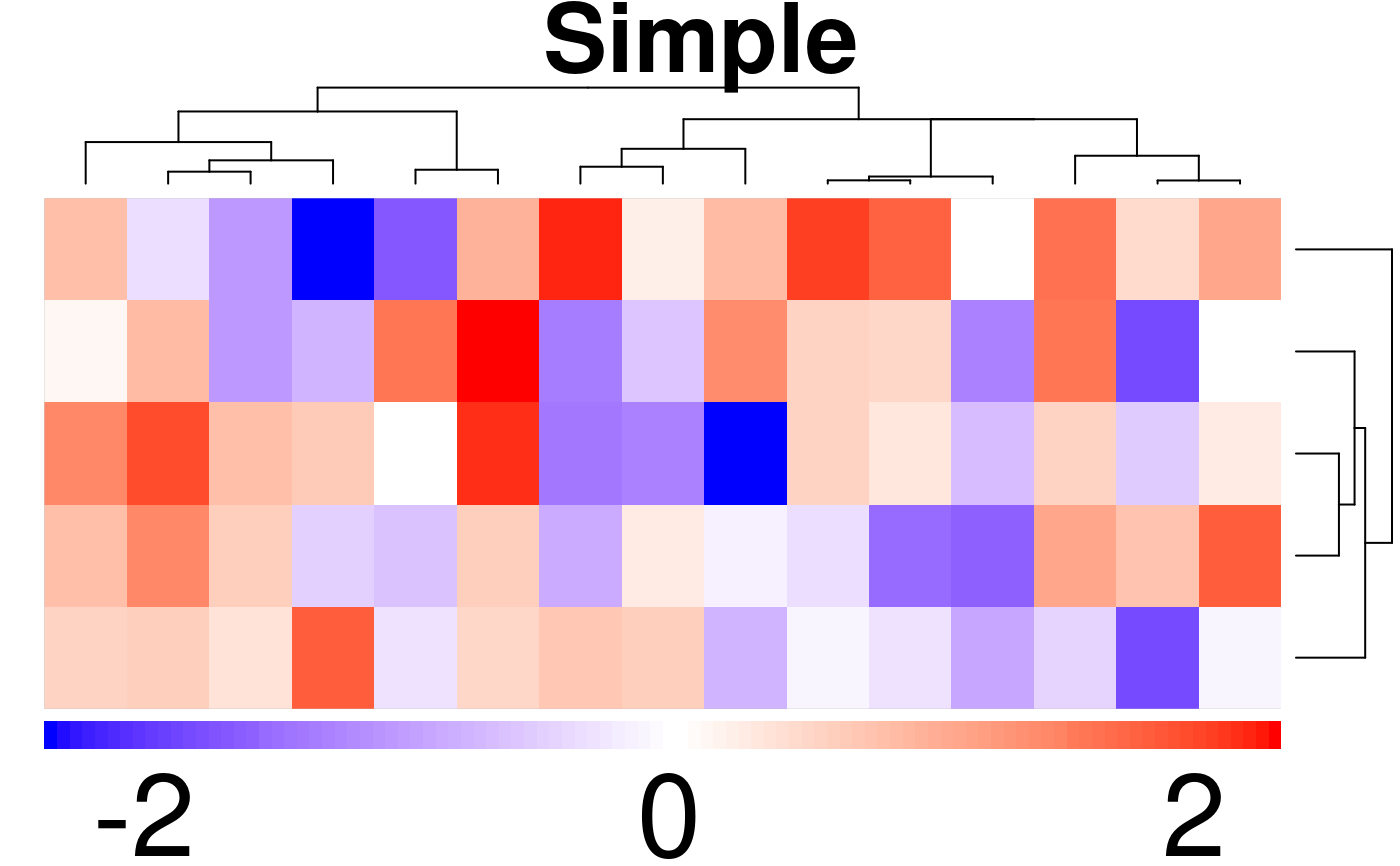
x = simple.data,
main = 'Simple',
description = 'Heatmap created using BoutrosLab.plotting.general',
resolution = 100
);
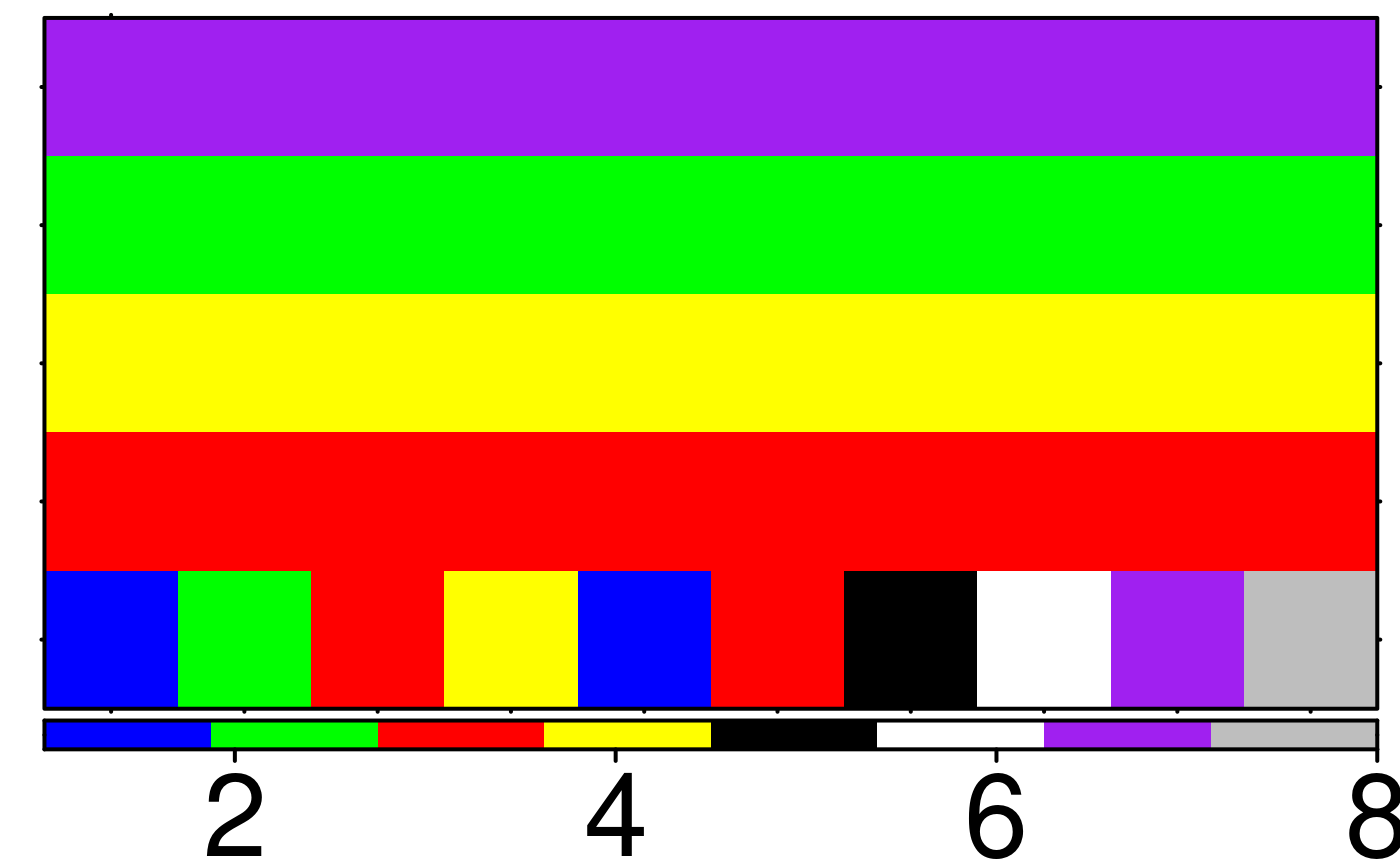
 simple.data.col <- data.frame(
x <- c('blue','green','red','yellow','blue','red','black','white','purple','grey'),
y <- rep('red',10),
z <- rep('yellow',10),
v <- rep('green',10),
w <- rep('purple',10)
);
# Input Colours Provided
create.heatmap(
# filename = tempfile(pattern = 'Heatmap_Simple_Using_Colours', fileext = '.tiff'),
x = simple.data.col,
clustering.method = 'none',
input.colours = TRUE,
resolution = 100
);
 # Single Input Colour Provided
create.heatmap(
# filename = tempfile(pattern = 'Heatmap_Simple_Using_Single_Colour', fileext = '.tiff'),
x = simple.data.col[, ncol(simple.data.col), drop = FALSE],
clustering.method = 'none',
input.colours = TRUE,
resolution = 100
);
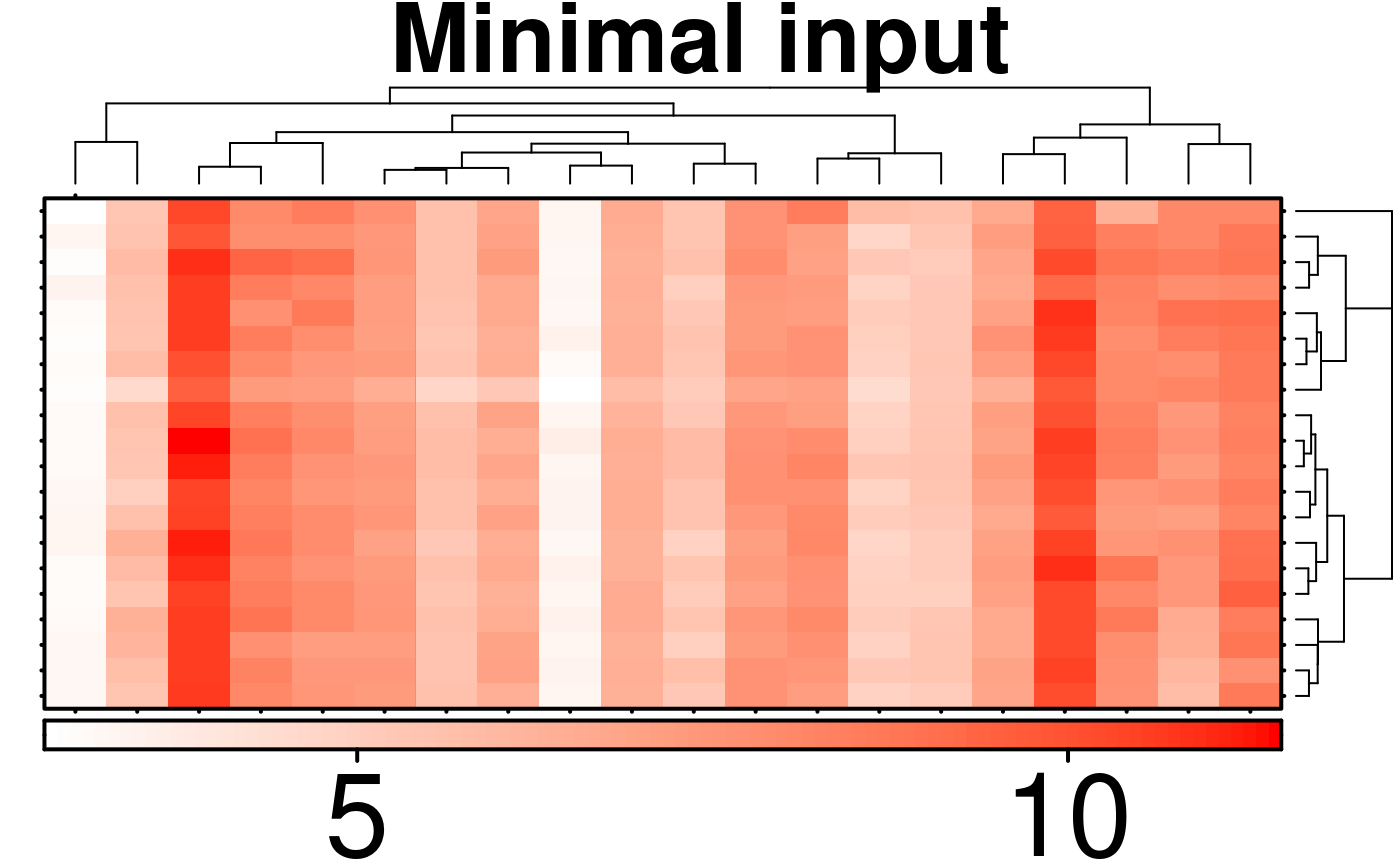
 # Minimal Input
create.heatmap(
# filename = tempfile(pattern = 'Heatmap_Minimal_Input', fileext = '.tiff'),
x = microarray[1:20, 1:20],
main = 'Minimal input',
description = 'Heatmap created using BoutrosLab.plotting.general',
resolution = 100
);
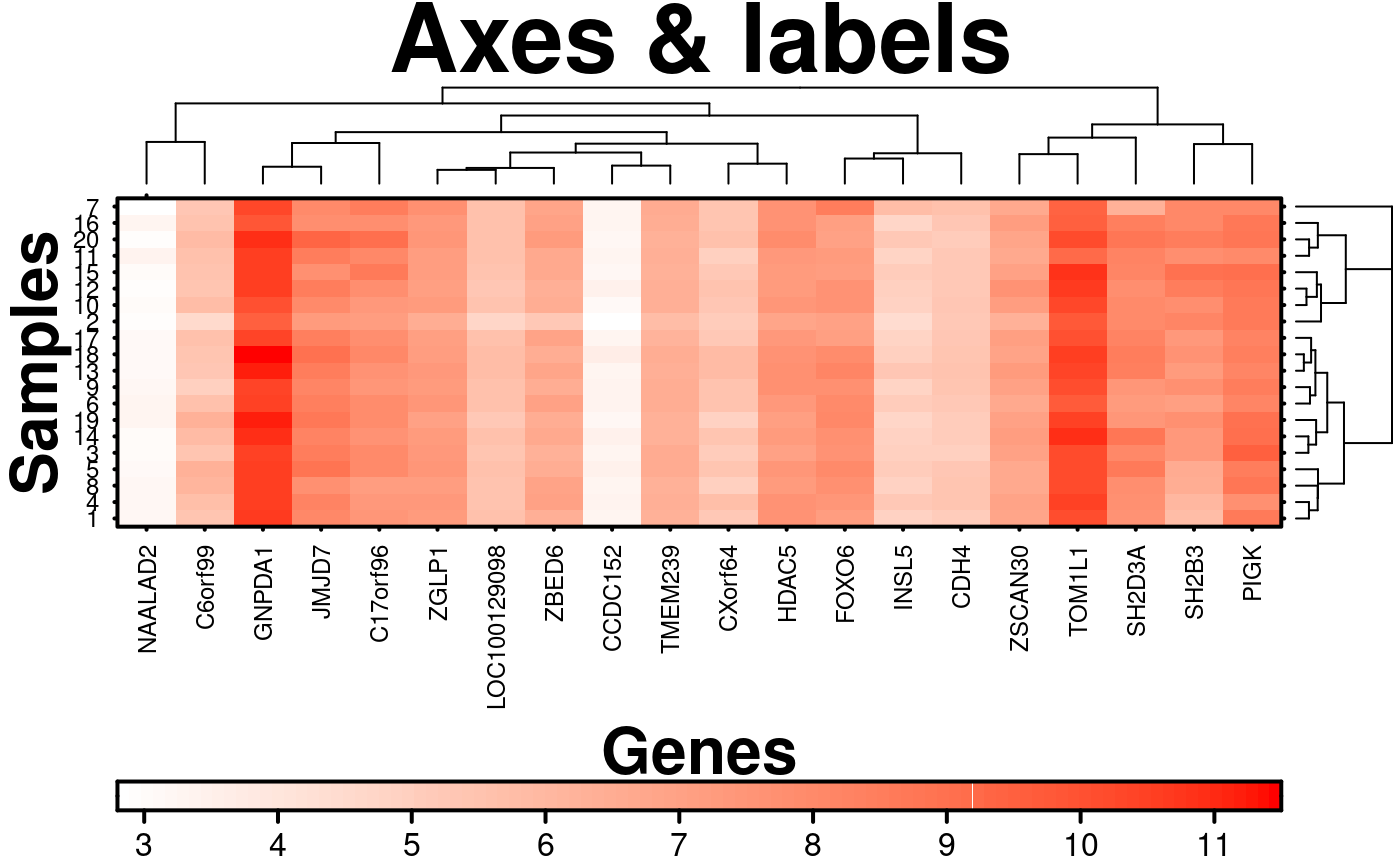
 # Axes and labels
create.heatmap(
# filename = tempfile(pattern = 'Heatmap_Axes_Labels', fileext = '.tiff'),
x = microarray[1:20, 1:20],
main = 'Axes & labels',
# Changing axes
xlab.label = 'Genes',
ylab.label = 'Samples',
# Turning on default row and column labels
xaxis.lab = NA,
yaxis.lab = 1:20,
# Adjusting font sizes
xaxis.cex = 0.75,
yaxis.cex = 0.75,
xaxis.fontface = 1,
yaxis.fontface = 1,
# Changing colourkey
colourkey.cex = 1,
colourkey.labels.at = seq(2,12,1),
description = 'Heatmap created using BoutrosLab.plotting.general',
resolution = 100
);
 # \donttest{
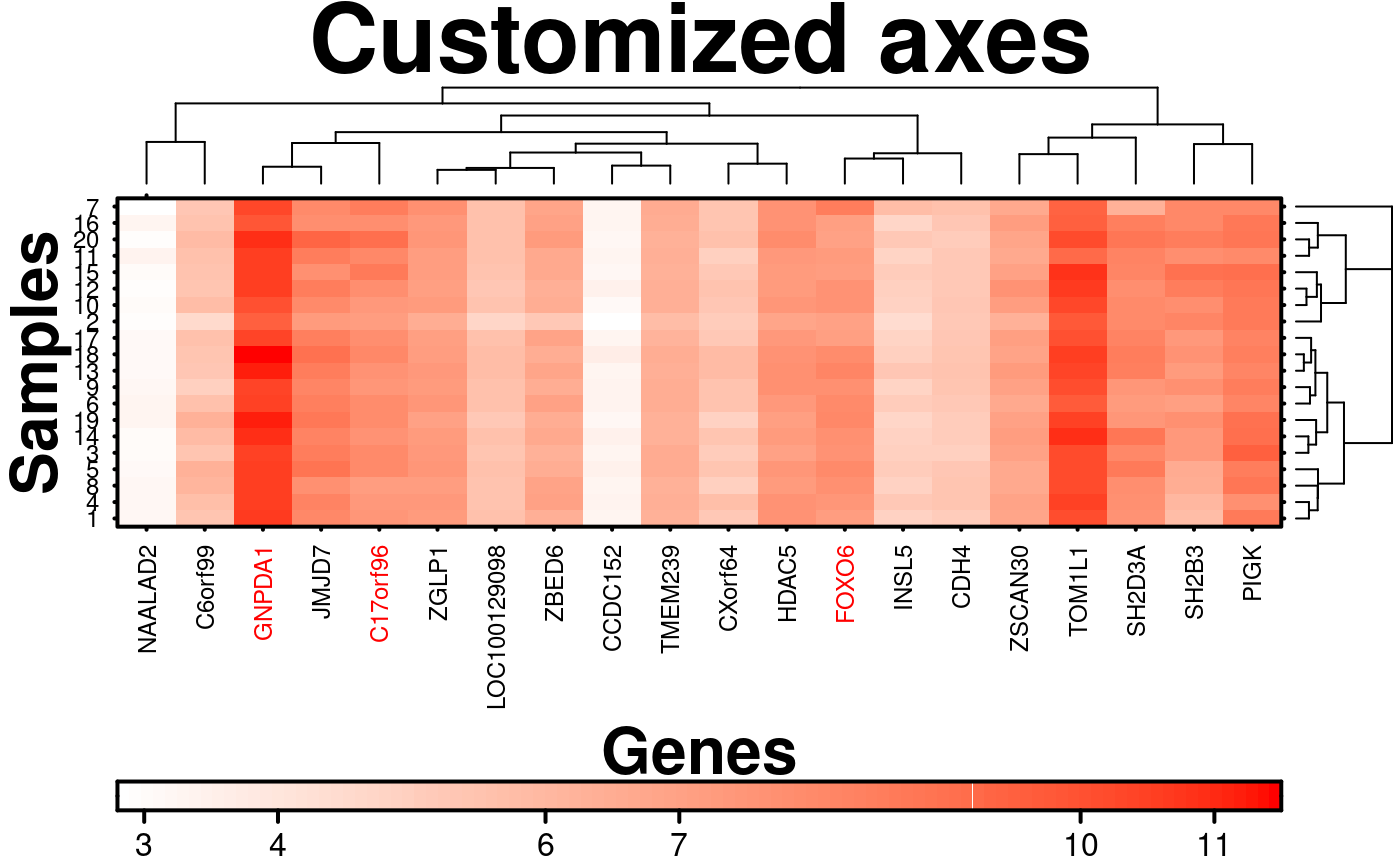
# Custom Axes
create.heatmap(
# filename = tempfile(pattern = 'Heatmap_Custom_Axes', fileext = '.tiff'),
x = microarray[1:20, 1:20],
main = 'Customized axes',
xlab.label = 'Genes',
ylab.label = 'Samples',
xaxis.lab = NA,
yaxis.lab = 1:20,
xaxis.cex = 0.75,
yaxis.cex = 0.75,
xaxis.fontface = 1,
yaxis.fontface = 1,
colourkey.cex = 1,
# Specify where to place tick marks
colourkey.labels.at = c(3,4, 6, 7, 10, 11),
# Specify label colours (note: this is based on the pre-clustering order)
xaxis.col = c('black', 'red',rep('black',6), 'red','black', 'black','red',rep('black',8)),
description = 'Heatmap created using BoutrosLab.plotting.general',
resolution = 200
);
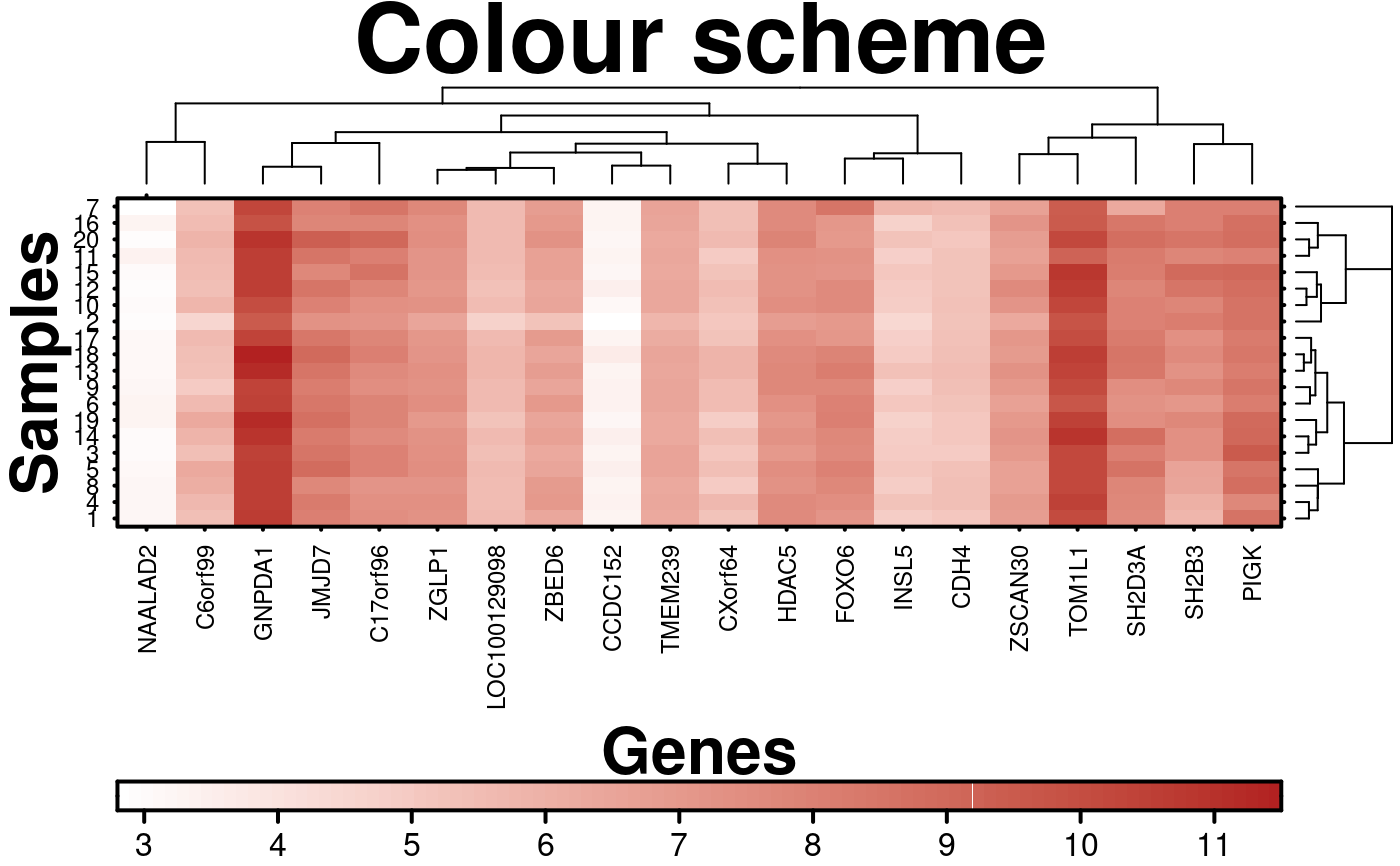
 # Two-sided Colour Scheme
create.heatmap(
# filename = tempfile(pattern = 'Heatmap_Colour_Scheme_1', fileext = '.tiff'),
x = microarray[1:20, 1:20],
main = 'Colour scheme',
xlab.label = 'Genes',
ylab.label = 'Samples',
xaxis.lab = NA,
yaxis.lab = 1:20,
xaxis.cex = 0.75,
yaxis.cex = 0.75,
xaxis.fontface = 1,
yaxis.fontface = 1,
colourkey.cex = 1,
colourkey.labels.at = seq(2,12,1),
# Changing the colours
colour.scheme = c('white','firebrick'),
description = 'Heatmap created using BoutrosLab.plotting.general',
resolution = 200
);
 # Three-sided Colour Scheme
# Note: when using a three-sided colour scheme, it is advised to have two-sided data
create.heatmap(
# filename = tempfile(pattern = 'Heatmap_Colour_Scheme_2', fileext = '.tiff'),
x = microarray[1:20, 1:20],
main = 'Colour scheme',
xlab.label = 'Genes',
ylab.label = 'Samples',
xaxis.lab = NA,
yaxis.lab = 1:20,
xaxis.cex = 0.75,
yaxis.cex = 0.75,
xaxis.fontface = 1,
yaxis.fontface = 1,
colourkey.cex = 1,
# Changing the colours
colour.scheme = c('red','white','turquoise'),
# Scale the data to center around the mean
scale.data = TRUE,
description = 'Heatmap created using BoutrosLab.plotting.general',
resolution = 200
);
 # Colour Alpha
create.heatmap(
# filename = tempfile(pattern = 'Heatmap_Colour_Alpha', fileext = '.tiff'),
x = microarray[1:20, 1:20],
main = 'Colours alpha',
xlab.label = 'Genes',
ylab.label = 'Samples',
xaxis.lab = NA,
yaxis.lab = 1:20,
xaxis.cex = 0.75,
yaxis.cex = 0.75,
xaxis.fontface = 1,
yaxis.fontface = 1,
colourkey.cex = 1,
colourkey.labels.at = seq(2,12,1),
# Adjusting the alpha value of the colours
colour.alpha = 'automatic',
description = 'Heatmap created using BoutrosLab.plotting.general',
resolution = 200
);
 # Clustering
create.heatmap(
# filename = tempfile(pattern = 'Heatmap_No_Clustering', fileext = '.tiff'),
x = microarray[1:20, 1:20],
main = 'No clustering',
xlab.label = 'Genes',
ylab.label = 'Samples',
xaxis.lab = NA,
yaxis.lab = 1:20,
xaxis.cex = 0.75,
yaxis.cex = 0.75,
xaxis.fontface = 1,
yaxis.fontface = 1,
colourkey.cex = 1,
colourkey.labels.at = seq(2,12,1),
colour.alpha = 'automatic',
# Turning clustering off
clustering.method = 'none',
description = 'Heatmap created using BoutrosLab.plotting.general',
resolution = 200
);
 # Clustering
create.heatmap(
# filename = tempfile(pattern = 'Heatmap_Clustering_Methods', fileext = '.tiff'),
x = microarray[1:20, 1:20],
main = 'Clustering methods',
xlab.label = 'Genes',
ylab.label = 'Samples',
xaxis.lab = NA,
yaxis.lab = 1:20,
xaxis.cex = 0.75,
yaxis.cex = 0.75,
xaxis.fontface = 1,
yaxis.fontface = 1,
colourkey.cex = 1,
colourkey.labels.at = seq(2,12,1),
colour.alpha = 'automatic',
# Clustering method defaults to 'diana', but can be set to other options
clustering.method = 'complete',
# Also setting the distance measures
rows.distance.method = 'euclidean',
cols.distance.method = 'manhattan',
description = 'Heatmap created using BoutrosLab.plotting.general',
resolution = 200
);
# Clustering
create.heatmap(
# filename = tempfile(pattern = 'Heatmap_Clustering_Methods', fileext = '.tiff'),
x = microarray[1:20, 1:20],
main = 'Clustering methods',
xlab.label = 'Genes',
ylab.label = 'Samples',
xaxis.lab = NA,
yaxis.lab = 1:20,
xaxis.cex = 0.75,
yaxis.cex = 0.75,
xaxis.fontface = 1,
yaxis.fontface = 1,
colourkey.cex = 1,
colourkey.labels.at = seq(2,12,1),
colour.alpha = 'automatic',
# Clustering method defaults to 'diana', but can be set to other options
clustering.method = 'complete',
# Also setting the distance measures
rows.distance.method = 'euclidean',
cols.distance.method = 'manhattan',
description = 'Heatmap created using BoutrosLab.plotting.general',
resolution = 200
);
 # Stratified Clustering
create.heatmap(
# filename = tempfile(pattern = 'Heatmap_Stratified_Clustering', fileext = '.tiff'),
x = microarray[1:20, 1:20],
main = 'Stratified clustering',
xlab.label = 'Genes',
ylab.label = 'Samples',
xaxis.lab = NA,
yaxis.lab = 1:20,,
xaxis.cex = 0.75,
yaxis.cex = 0.75,
xaxis.fontface = 1,
yaxis.fontface = 1,
colourkey.cex = 1,
colourkey.labels.at = seq(2,12,1),
colour.alpha = 'automatic',
# Stratifying the clustering by rows
stratified.clusters.rows = list(c(1:10), c(11:20)),
# Adding line to show highlight the division between the two strata
grid.row = TRUE,
row.lines = 10.5,
row.lwd = 2,
description = 'Heatmap created using BoutrosLab.plotting.general',
resolution = 200
);
 # Dendrogram provided
col.dendrogram <- BoutrosLab.plotting.general::create.dendrogram(
x = microarray[1:20, 1:20],
cluster.dimension = 'col'
);
row.dendrogram <- BoutrosLab.plotting.general::create.dendrogram(
x = microarray[1:20, 1:20],
cluster.dimension = 'row'
);
create.heatmap(
# filename = tempfile(pattern = 'Heatmap_Dendrogram_Provided', fileext = '.tiff'),
x = microarray[1:20, 1:20],
main = 'Dendrogram provided',
xlab.label = 'Genes',
ylab.label = 'Samples',
xaxis.lab = NA,
yaxis.lab = 1:20,
xaxis.cex = 0.75,
yaxis.cex = 0.75,
xaxis.fontface = 1,
yaxis.fontface = 1,
colourkey.cex = 1,
colourkey.labels.at = seq(2,12,1),
colour.alpha = 'automatic',
# note: row/column dendrograms are switched because the function inverts rows and columns
clustering.method = 'none',
row.dendrogram = col.dendrogram,
col.dendrogram = row.dendrogram,
# Adjusting the size of the dendrogram
right.dendrogram.size = 3,
top.dendrogram.size = 2.5,
description = 'Heatmap created using BoutrosLab.plotting.general',
resolution = 200
);
 # Covariates and Legends
# Note: covariates can also be added using the create.multiplot function
# set the colour schemes for the covariates
sex.colours <- patient$sex;
sex.colours[sex.colours == 'male'] <- 'dodgerblue';
sex.colours[sex.colours == 'female'] <- 'pink';
stage.colours <- patient$stage;
stage.colours[stage.colours == 'I'] <- 'plum1';
stage.colours[stage.colours == 'II'] <- 'orchid1';
stage.colours[stage.colours == 'III'] <- 'orchid3';
stage.colours[stage.colours == 'IV'] <- 'orchid4';
# create an object to draw the covariates from
sample.covariate <- list(
rect = list(
col = 'black',
fill = sex.colours,
lwd = 1.5
),
rect = list(
col = 'black',
fill = stage.colours,
lwd = 1.5
)
);
# create a legend for the covariates
sample.cov.legend <- list(
legend = list(
colours = c('dodgerblue', 'pink'),
labels = c('male','female'),
title = 'Sex'
),
legend = list(
colours = c('plum1', 'orchid1','orchid3', 'orchid4'),
labels = c('I','II', 'III', 'IV'),
title = 'Stage'
)
);
create.heatmap(
# filename = tempfile(pattern = 'Heatmap_Covariates_Simple', fileext = '.tiff'),
x = microarray[1:20, 1:20],
main = 'Covariates',
xlab.label = 'Genes',
ylab.label = 'Samples',
xaxis.lab = NA,
yaxis.lab = 1:20,
xaxis.cex = 0.75,
yaxis.cex = 0.75,
xaxis.fontface = 1,
yaxis.fontface = 1,
colourkey.cex = 1,
colourkey.labels.at = seq(2,12,1),
colour.alpha = 'automatic',
# adding covariates and corresponding legend
covariates = sample.covariate,
covariate.legend = sample.cov.legend,
description = 'Heatmap created using BoutrosLab.plotting.general',
resolution = 200
);
#> Warning: 'x' is NULL so the result will be NULL
#> Warning: 'x' is NULL so the result will be NULL
 # Top covariate and legend customization
chr.cov.colours <- microarray$Chr;
chr.cov.colours[microarray$Chr == 1] <- default.colours(3, palette.type = 'chromosomes')[1];
chr.cov.colours[microarray$Chr == 2] <- default.colours(3, palette.type = 'chromosomes')[2];
chr.cov.colours[microarray$Chr == 3] <- default.colours(3, palette.type = 'chromosomes')[3];
chr.covariate <- list(
rect = list(
col = 'white',
fill = chr.cov.colours,
lwd = 1.5
)
);
# join covariate legends
combo.cov.legend <- list(
legend = list(
colours = default.colours(3, palette.type = 'chromosomes'),
labels = c('1','2', '3'),
title = 'Chromosome',
border = 'white'
),
legend = list(
colours = c('dodgerblue', 'pink'),
labels = c('male','female'),
title = 'Sex'
),
legend = list(
colours = c('plum1', 'orchid1','orchid3', 'orchid4'),
labels = c('I','II', 'III', 'IV'),
title = 'Stage'
)
);
create.heatmap(
# filename = tempfile(pattern = 'Heatmap_Covariate_Legend_Custom', fileext = '.tiff'),
x = microarray[1:20, 1:20],
main = 'Custom covariates & legend',
xlab.label = 'Genes',
ylab.label = 'Samples',
xaxis.lab = NA,
yaxis.lab = 1:20,
xaxis.cex = 0.75,
yaxis.cex = 0.75,
xaxis.fontface = 1,
yaxis.fontface = 1,
colourkey.cex = 1,
colourkey.labels.at = seq(2,12,1),
colour.alpha = 'automatic',
clustering.method = 'none',
# side covariate
covariates = sample.covariate,
# top covariate and covariate border specification
covariates.top = chr.covariate,
covariate.legend = combo.cov.legend,
# making outline of border a matching green
covariates.top.grid.border = list(col = 'lightblue', lwd = 2),
# making certain column divisions a different colour
covariates.top.col.lines = c(5,6),
covariates.top.grid.col = list(col = 'blue', lwd = 2),
# legend customization
legend.side = c('right','left','top'),
legend.title.cex = 0.75,
legend.cex = 0.75,
legend.title.just = 'left',
legend.border = list(lwd = 1),
description = 'Heatmap created using BoutrosLab.plotting.general',
resolution = 200
);
#> Warning: 'x' is NULL so the result will be NULL
#> Warning: 'x' is NULL so the result will be NULL
 # Custom gridlines
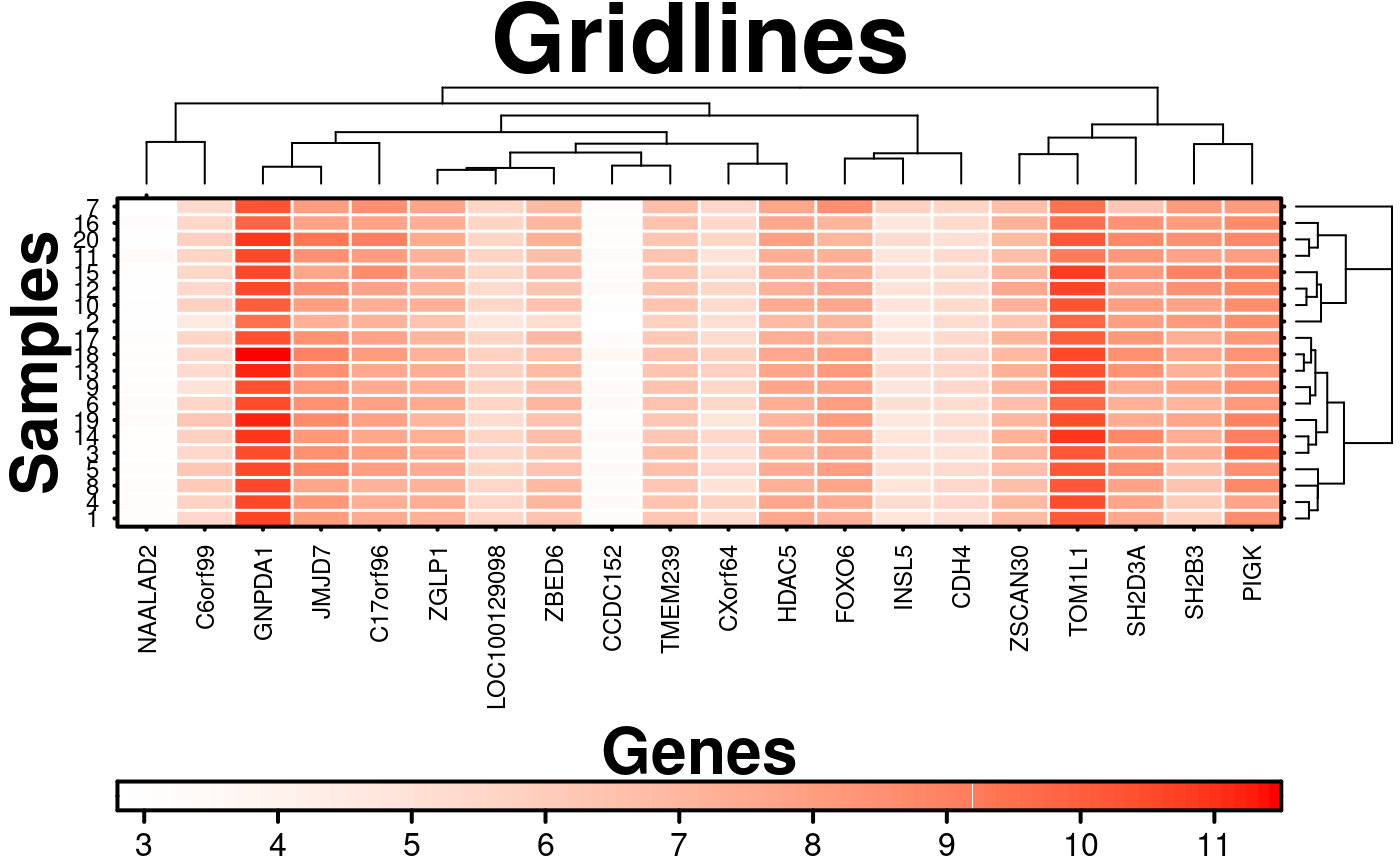
create.heatmap(
# filename = tempfile(pattern = 'Heatmap_Gridlines', fileext = '.tiff'),
x = microarray[1:20, 1:20],
main = 'Gridlines',
xlab.label = 'Genes',
ylab.label = 'Samples',
xaxis.lab = NA,
yaxis.lab = 1:20,
xaxis.cex = 0.75,
yaxis.cex = 0.75,
xaxis.fontface = 1,
yaxis.fontface = 1,
colourkey.cex = 1,
colourkey.labels.at = seq(2,12,1),
colour.alpha = 'automatic',
# colouring gridlines
grid.row = TRUE,
grid.col = TRUE,
row.colour = 'white',
col.colour = 'white',
row.lwd = 1.5,
col.lwd = 1.5,
description = 'Heatmap created using BoutrosLab.plotting.general',
resolution = 200
);
 # Label cells
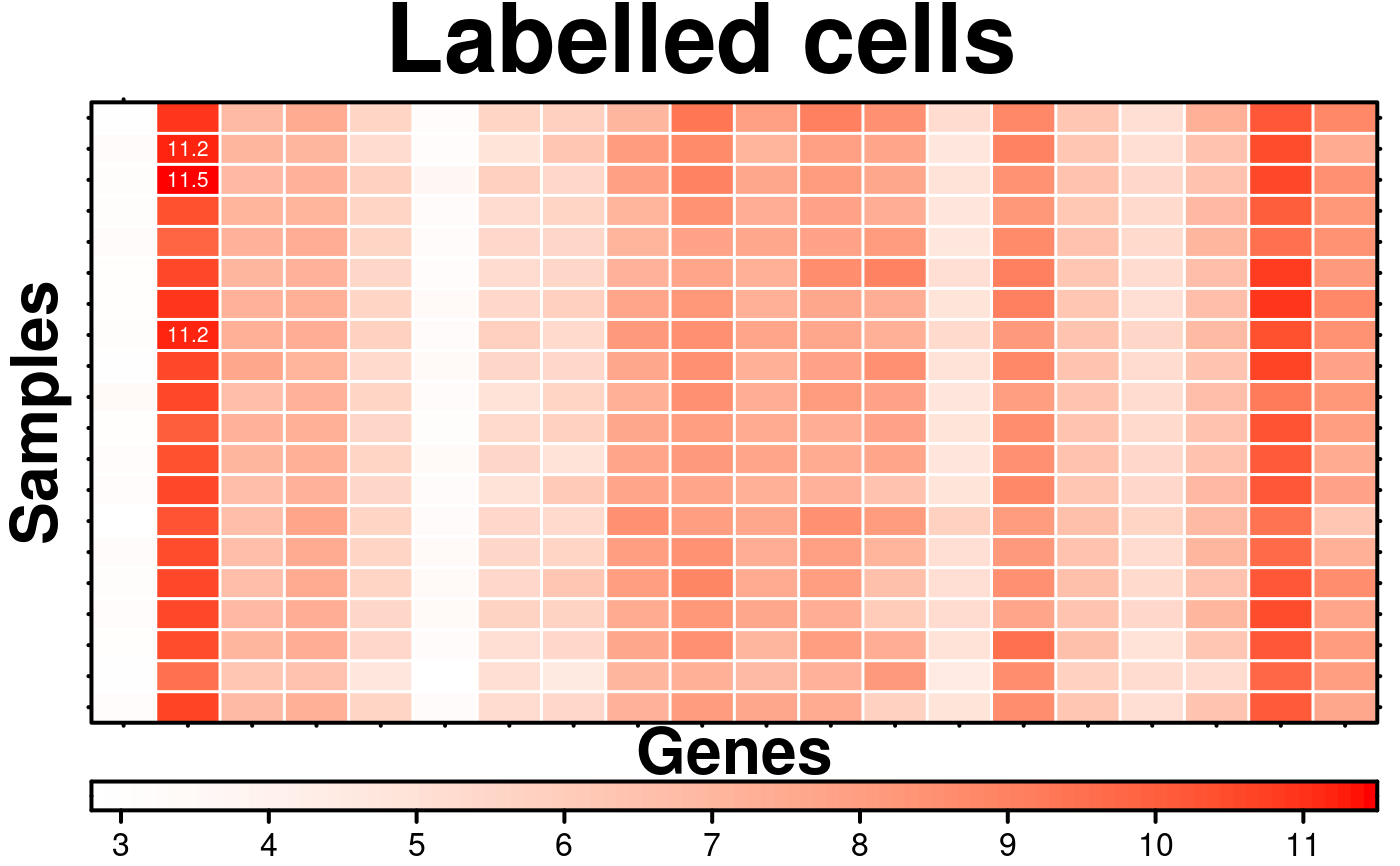
create.heatmap(
# filename = tempfile(pattern = 'Heatmap_Labelled_Cells', fileext = '.tiff'),
x = microarray[1:20, 1:20],
main = 'Labelled cells',
xlab.label = 'Genes',
ylab.label = 'Samples',
xaxis.cex = 0.75,
yaxis.cex = 0.75,
xaxis.fontface = 1,
yaxis.fontface = 1,
colourkey.cex = 1,
colourkey.labels.at = seq(2,12,1),
colour.alpha = 'automatic',
grid.row = TRUE,
grid.col = TRUE,
row.colour = 'white',
col.colour = 'white',
row.lwd = 1.5,
col.lwd = 1.5,
clustering.method = 'none',
# conditionally labelling cells
# flipping rows and columns because the heatmap function does so
row.pos = which(microarray[1:20, 1:20] > 11, arr.ind = TRUE)[,2],
col.pos = which(microarray[1:20, 1:20] > 11, arr.ind = TRUE)[,1],
cell.text = microarray[1:20, 1:20][microarray[1:20, 1:20] > 11],
text.col = 'white',
text.cex = 0.65,
description = 'Heatmap created using BoutrosLab.plotting.general',
resolution = 200
);
 # Label cells
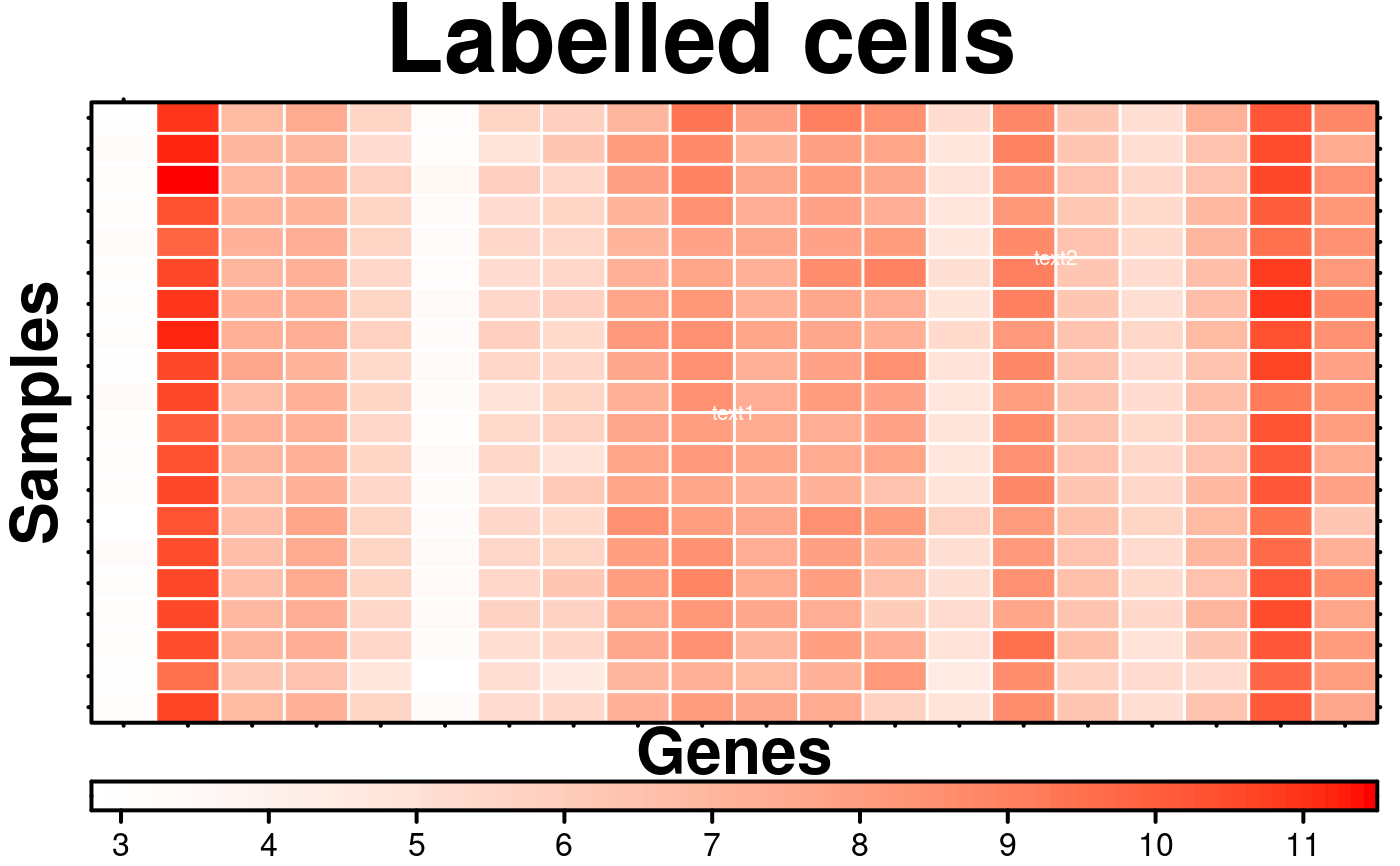
create.heatmap(
# filename = tempfile(pattern = 'Heatmap_Labelled_Cells_NPC', fileext = '.tiff'),
x = microarray[1:20, 1:20],
main = 'Labelled cells',
xlab.label = 'Genes',
ylab.label = 'Samples',
xaxis.cex = 0.75,
yaxis.cex = 0.75,
xaxis.fontface = 1,
yaxis.fontface = 1,
colourkey.cex = 1,
colourkey.labels.at = seq(2,12,1),
colour.alpha = 'automatic',
grid.row = TRUE,
grid.col = TRUE,
row.colour = 'white',
col.colour = 'white',
row.lwd = 1.5,
col.lwd = 1.5,
clustering.method = 'none',
text.use.grid.coordinates = FALSE,
# conditionally labelling cells
# flipping rows and columns because the heatmap function does so
cell.text = c("text1","text2"),
text.col = 'white',
text.cex = 0.65,
text.position = list(c(0.5,0.5),c(0.75,0.75)),
description = 'Heatmap created using BoutrosLab.plotting.general',
resolution = 200
);
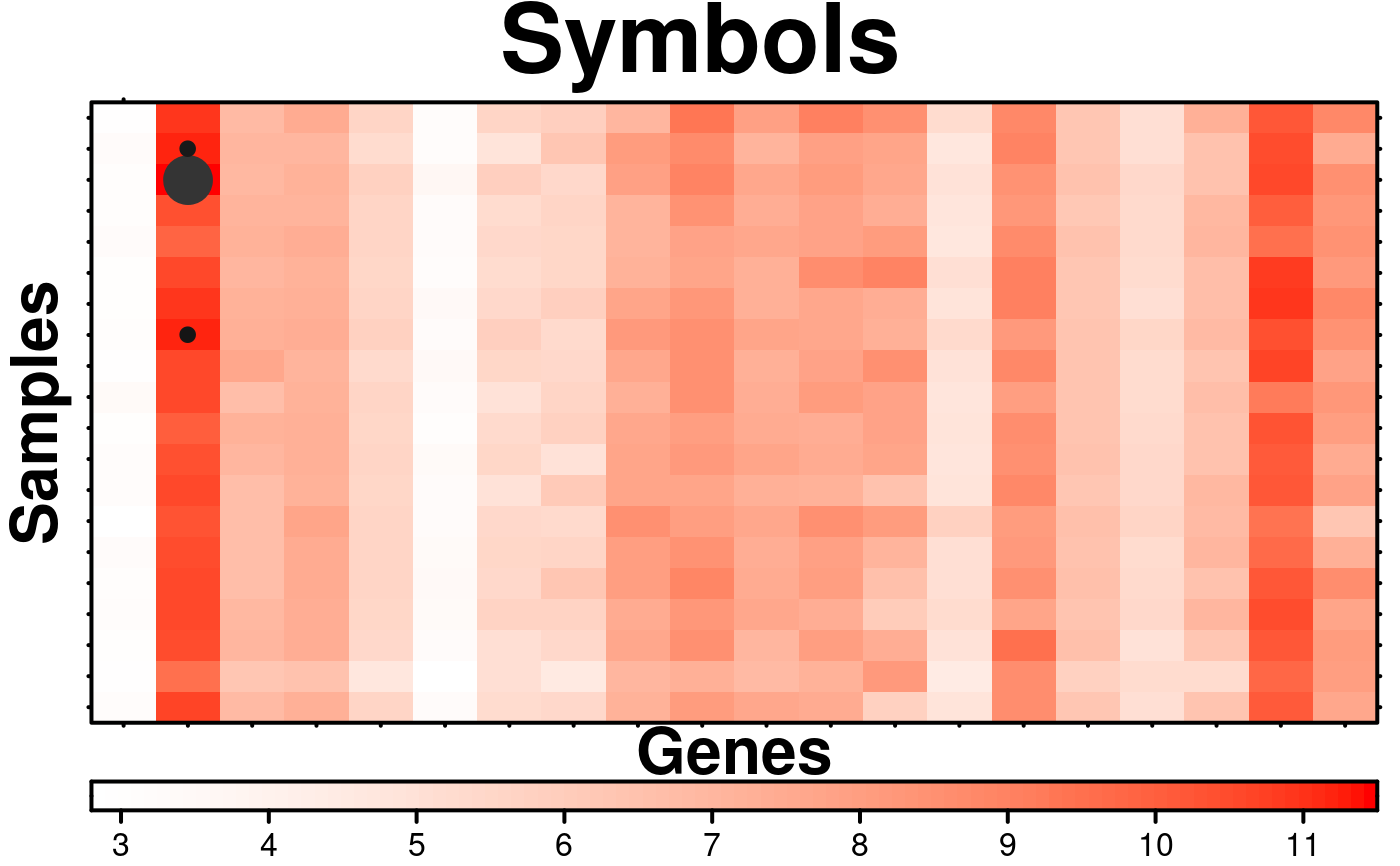
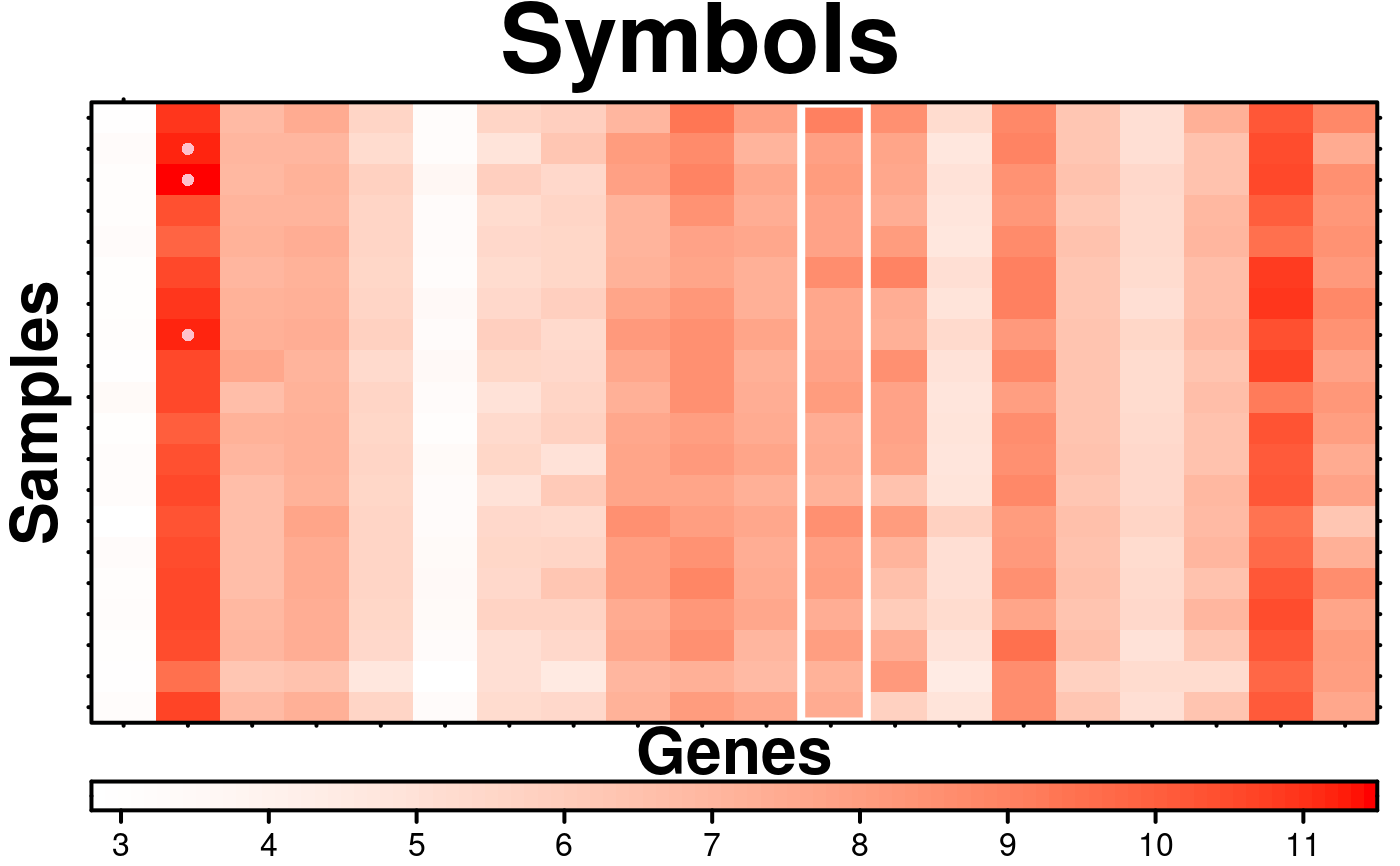
 # Method 1 of adding symbols (very similar to how text is added)
points <- microarray[1:20, 1:20][microarray[1:20, 1:20] > 11];
size.from <- range(points, na.rm = TRUE);
size.to <- c(1,3);
point.size <- (points - size.from[1])/diff(size.from) * diff(size.to) + size.to[1];
point.colour <- grey(runif(sum(microarray[1:20, 1:20] > 11), max = 0.5));
create.heatmap(
# filename = tempfile(pattern = 'Heatmap_Symbols_1', fileext = '.tiff'),
x = microarray[1:20, 1:20],
main = 'Symbols',
xlab.label = 'Genes',
ylab.label = 'Samples',
xaxis.cex = 0.75,
yaxis.cex = 0.75,
xaxis.fontface = 1,
yaxis.fontface = 1,
colourkey.cex = 1,
colourkey.labels.at = seq(2,12,1),
colour.alpha = 'automatic',
clustering.method = 'none',
# conditionally adding points to cells
# flipping rows and columns because the heatmap function does so
row.pos = which(microarray[1:20, 1:20] > 11, arr.ind = TRUE)[,2],
col.pos = which(microarray[1:20, 1:20] > 11, arr.ind = TRUE)[,1],
cell.text = rep(expression("\u2022"), times = sum(microarray[1:20, 1:20] > 11)),
text.col = point.colour,
text.cex = point.size,
description = 'Heatmap created using BoutrosLab.plotting.general',
resolution = 200
);
 # Method 2 of Adding Symbols
# Create matrices to describe the symbols
circle.matrix <- matrix(
nrow = 20,
ncol = 20,
data = FALSE
);
circle.colour.matrix <- matrix(
nrow = 20,
ncol = 20,
data = 'pink'
);
circle.size.matrix <- matrix(
nrow = 20,
ncol = 20,
data = 20
);
border.matrix <- matrix(
nrow = 20,
ncol = 20,
data = FALSE
);
border.colour.matrix <- matrix(
nrow = 20,
ncol = 20,
data = 'black'
);
border.size.matrix <- matrix(
nrow = 20,
ncol = 20,
data = 4
);
square.matrix <- matrix(
nrow = 20,
ncol = 20,
data = FALSE
);
square.colour.matrix <- matrix(
nrow = 20,
ncol = 20,
data = 'pink'
);
square.size.matrix <- matrix(
nrow = 20,
ncol = 20,
data = 10
);
# setting up the symbols
symbol.locations <- list(
circles = list(
list(
x = circle.matrix,
col = circle.colour.matrix,
size = circle.size.matrix
)
),
borders = list(
list(
x = border.matrix,
col = border.colour.matrix,
size = border.size.matrix
),
# creating a border encompassing a larger area
list(
xright = 12.10,
xleft = 12,
ybottom = 1,
ytop = 20,
size = 4,
col = 'pink'
)
),
squares = list(
list(
x = square.matrix,
col = square.colour.matrix,
size = square.size.matrix
)
)
);
# Set which items in the matrix will be shown
# symbol.locations$borders[[1]]$x <- FALSE;
# symbol.locations$squares[[1]]$x <- FALSE;
symbol.locations$circles[[1]]$x[which(microarray[1:20,1:20] > 11, arr.ind = TRUE)] <- TRUE;
create.heatmap(
# filename = tempfile(pattern = 'Heatmap_Symbols_2', fileext = '.tiff'),
x = microarray[1:20, 1:20],
main = 'Symbols',
xlab.label = 'Genes',
ylab.label = 'Samples',
xaxis.cex = 0.75,
yaxis.cex = 0.75,
xaxis.fontface = 1,
yaxis.fontface = 1,
colourkey.cex = 1,
colourkey.labels.at = seq(2,12,1),
colour.alpha = 'automatic',
clustering.method = 'none',
# adding symbols
symbols = symbol.locations,
description = 'Heatmap created using BoutrosLab.plotting.general',
resolution = 200
);
 # Rotate matrix
create.heatmap(
# filename = tempfile(pattern = 'Heatmap_Rotated_Matrix', fileext = '.tiff'),
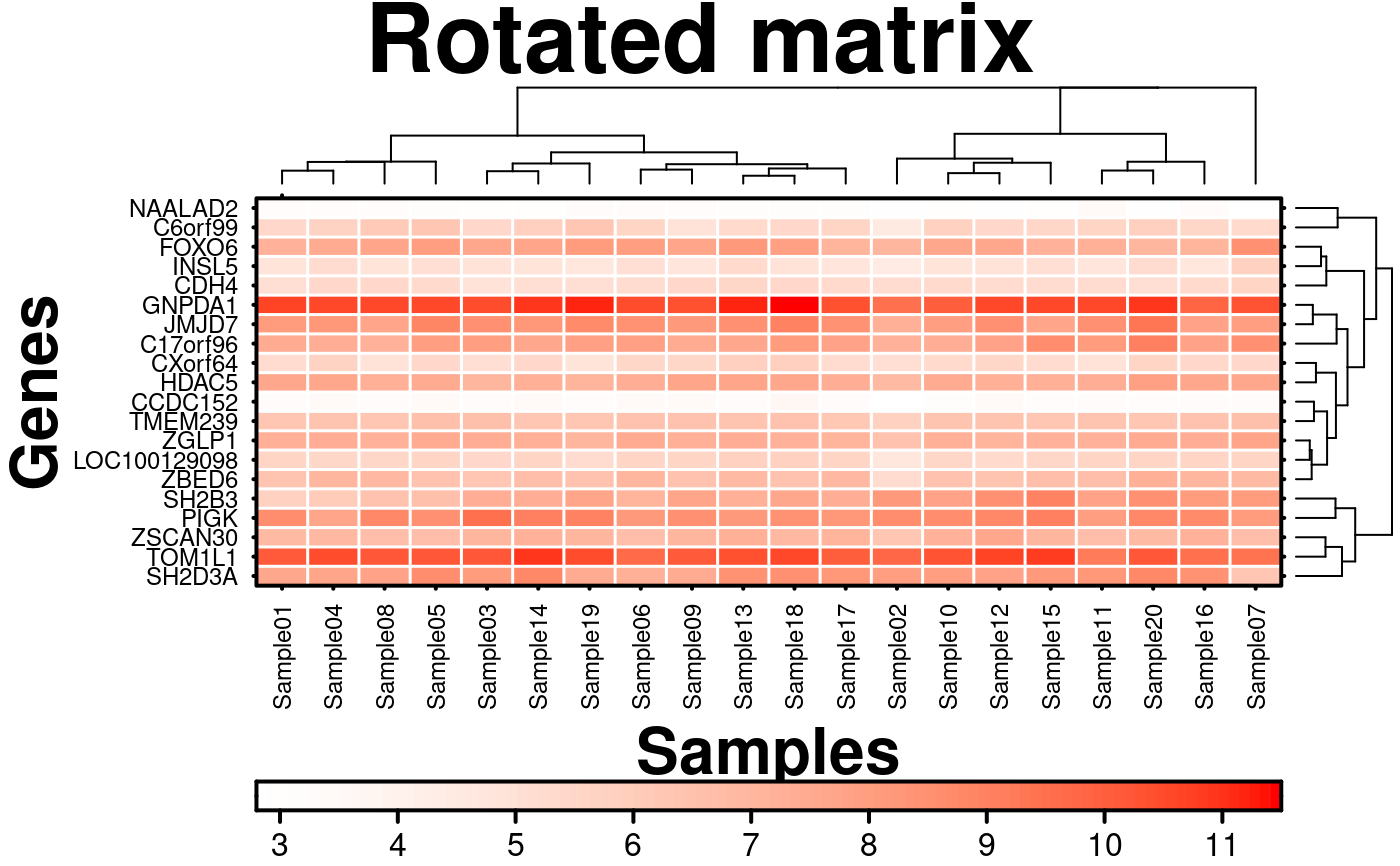
x = microarray[1:20, 1:20],
main = 'Rotated matrix',
# Also flip labels
ylab.label = 'Genes',
xlab.label = 'Samples',
xaxis.lab = NA,
yaxis.lab = NA,
xaxis.cex = 0.75,
yaxis.cex = 0.75,
xaxis.fontface = 1,
yaxis.fontface = 1,
colourkey.cex = 1,
colourkey.labels.at = seq(2,12,1),
colour.alpha = 'automatic',
grid.row = TRUE,
grid.col = TRUE,
row.colour = 'white',
col.colour = 'white',
row.lwd = 1.5,
col.lwd = 1.5,
# stop heatmap function from rotating matrix
same.as.matrix = TRUE,
description = 'Heatmap created using BoutrosLab.plotting.general',
resolution = 200
);
 # Example of using discrete data
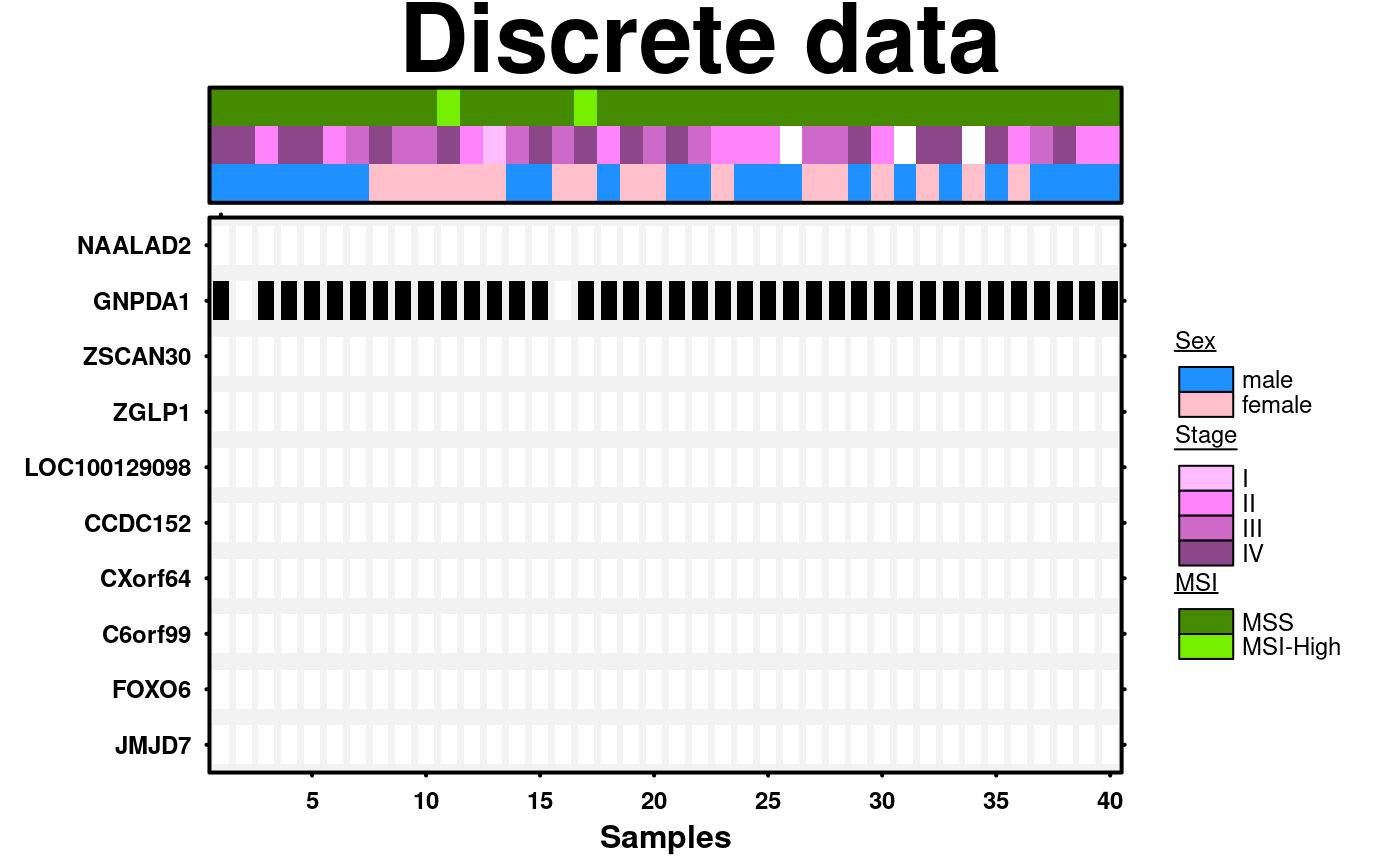
discrete.data <- microarray[1:10,1:40];
# Looking for values greater than 10
discrete.data[which(discrete.data < 10, arr.ind = TRUE)] <- 0;
discrete.data[which(discrete.data > 0, arr.ind = TRUE)] <- 1;
sex.colour <- as.character(patient$sex);
sex.colour[sex.colour == 'male'] <- 'dodgerblue';
sex.colour[sex.colour == 'female'] <- 'pink';
stage.colour <- as.character(patient$stage)
stage.colour[stage.colour == 'I'] <- 'plum1'
stage.colour[stage.colour == 'II'] <- 'orchid1'
stage.colour[stage.colour == 'III'] <- 'orchid3'
stage.colour[stage.colour == 'IV'] <- 'orchid4'
msi.colour <- as.character(patient$msi)
msi.colour[msi.colour == 'MSS'] <- 'chartreuse4'
msi.colour[msi.colour == 'MSI-High'] <- 'chartreuse2'
discrete.covariate <- list(
rect = list(
col = 'transparent',
fill = sex.colour,
lwd = 1.5
),
rect = list(
col = 'transparent',
fill = stage.colour,
lwd = 1.5
),
rect = list(
col = 'transparent',
fill = msi.colour,
lwd = 1.5
)
);
discrete.covariate.legend <- list(
legend = list(
colours = c('dodgerblue', 'pink'),
labels = c('male','female'),
title = expression(underline('Sex'))
),
legend = list(
colours = c('plum1', 'orchid1', 'orchid3', 'orchid4'),
labels = c('I','II', 'III', 'IV'),
title = expression(underline('Stage'))
),
legend = list(
colours = c('chartreuse4', 'chartreuse2'),
labels = c('MSS','MSI-High'),
title = expression(underline('MSI'))
)
);
create.heatmap(
# filename = tempfile(pattern = 'Heatmap_Discrete_Data', fileext = '.tiff'),
x = discrete.data,
main = 'Discrete data',
xlab.label = 'Samples',
same.as.matrix = TRUE,
# Customize plot
clustering.method = 'none',
total.colours = 3,
colour.scheme = c('white','black'),
fill.colour = 'grey95',
# Changing axes
xat = seq(0,40,5),
xaxis.lab = seq(0,40,5),
yaxis.lab = rownames(microarray)[1:10],
yaxis.cex = 0.75,
xaxis.cex = 0.75,
xaxis.rot = 0,
xlab.cex = 1,
# Covariates
covariates.top = discrete.covariate,
covariate.legend = discrete.covariate.legend,
legend.side = 'right',
legend.title.cex = 0.75,
legend.cex = 0.75,
legend.title.just = 'left',
legend.between.row = 0.2,
legend.border = list(col = 'transparent'),
legend.border.padding = 2,
shrink = 0.7,
covariates.top.grid.border = list(col = 'black', lwd = 2),
scale.data = FALSE,
print.colour.key = FALSE,
description = 'Heatmap created using BoutrosLab.plotting.general',
resolution = 200
);
#> Warning: 'x' is NULL so the result will be NULL
#> Warning: 'x' is NULL so the result will be NULL
#> Warning: 'x' is NULL so the result will be NULL
 # Correlation matrix
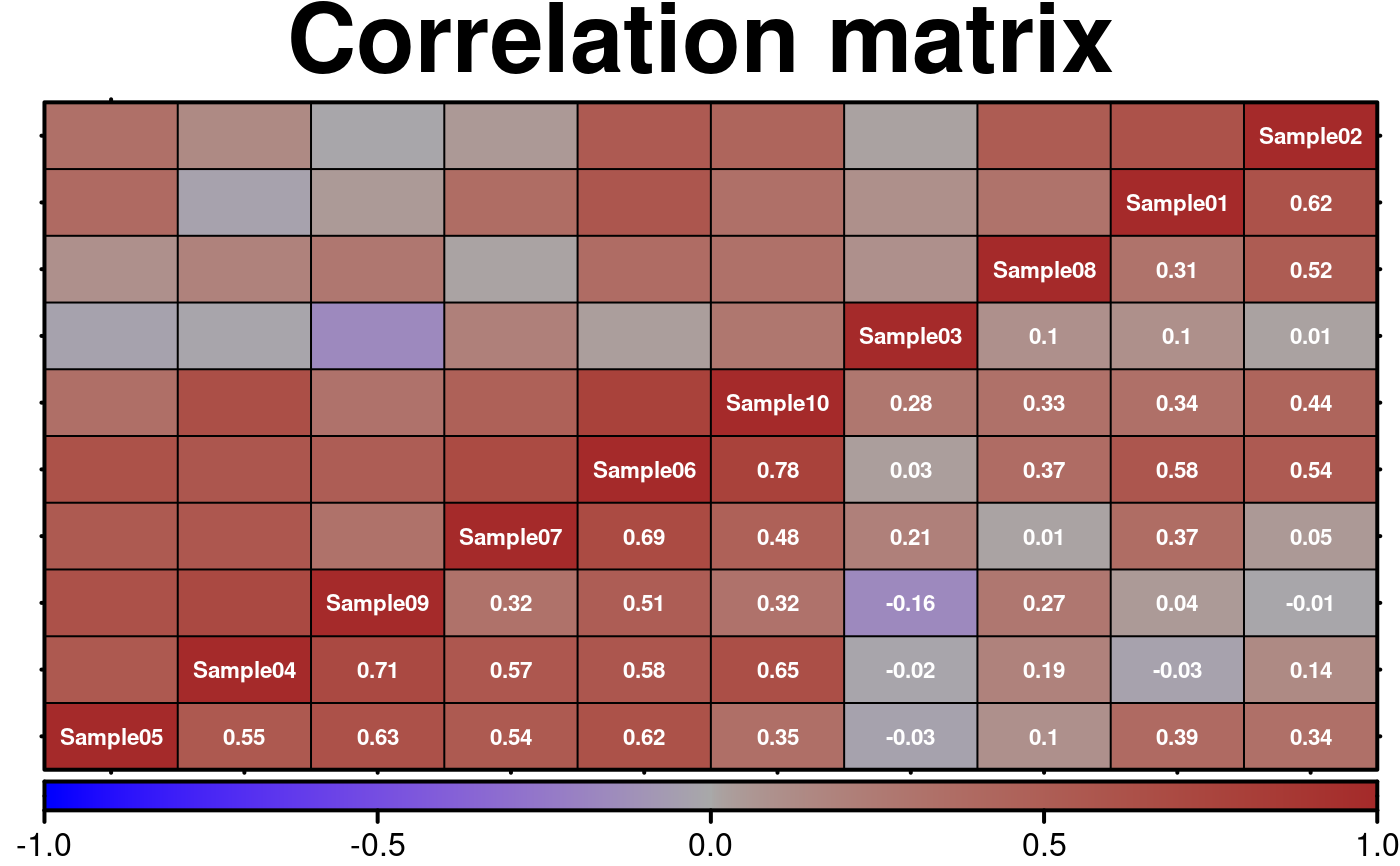
# Example of how to visualize the relationship between (e.x.) different cellularity estimates
# Generate a correlation matrix
cor.data <- cor(t(microarray[1:10,1:10]), method = 'spearman');
colnames(cor.data) <- colnames(microarray)[1:10];
# ensure that input data matrix is equal to what the heatmap clustering produces
distance.matrix <- as.dist(1 - cor(t(cor.data), use = "pairwise", method = "pearson"));
clustered.order <- hclust(d = distance.matrix, method = "ward")$order;
#> The "ward" method has been renamed to "ward.D"; note new "ward.D2"
cor.data <- cor.data[clustered.order, clustered.order];
# prepare labels
x <- round(cor.data, 2);
x[x == 1] <- colnames(x);
y <- x;
for (i in 1:(ncol(y)-1)) {
y[i, (i+1):nrow(y)] <- "";
};
create.heatmap(
# filename = tempfile(pattern = 'Heatmap_Cellularity_Estimates', fileext = '.tiff'),
x = cor.data,
main = 'Correlation matrix',
xaxis.lab = NULL,
yaxis.lab = NULL,
cell.text = y,
clustering.method = 'ward',
plot.dendrograms = 'none',
rows.distance.method = 'correlation',
cols.distance.method = 'correlation',
cor.method = 'pearson',
col.pos = which(y != '1', arr.ind = TRUE)[,1],
row.pos = which(y != '1', arr.ind = TRUE)[,2],
text.fontface = 2,
text.col = 'white',
text.cex = 0.70,
colourkey.cex = 1,
colour.scheme = c('blue', 'darkgrey', 'brown'),
colour.centering.value = 0,
at = seq(-1, 1, 0.001),
colour.alpha = 1.5,
grid.row = TRUE,
grid.col = TRUE,
description = 'Heatmap created using BoutrosLab.plotting.general',
resolution = 200
);
#> The "ward" method has been renamed to "ward.D"; note new "ward.D2"
#> The "ward" method has been renamed to "ward.D"; note new "ward.D2"
 # Discrete sequential colours
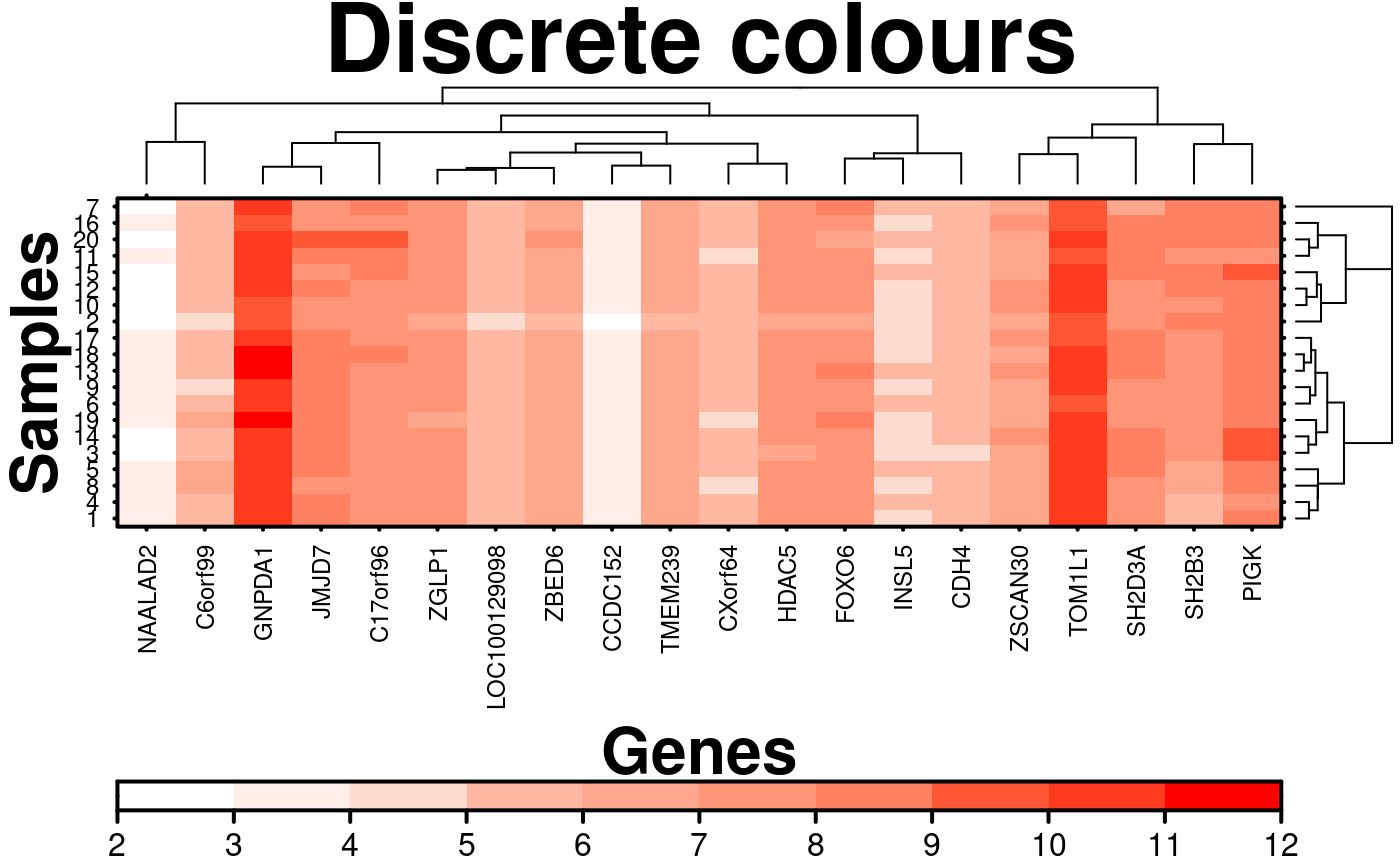
create.heatmap(
# filename = tempfile(pattern = 'Heatmap_Discrete_Colours_Sequential', fileext = '.tiff'),
x = microarray[1:20, 1:20],
main = 'Discrete colours',
xlab.label = 'Genes',
ylab.label = 'Samples',
xaxis.lab = NA,
yaxis.lab = 1:20,
xaxis.cex = 0.75,
yaxis.cex = 0.75,
xaxis.fontface = 1,
yaxis.fontface = 1,
colourkey.cex = 1,
# Adjusting total colours plotted
colourkey.labels.at = seq(2,12,1),
at = seq(2,12,1),
# Add one to account for a 'null' colour
total.colours = 11,
description = 'Heatmap created using BoutrosLab.plotting.general',
resolution = 200
);
 # Discrete qualitative colours
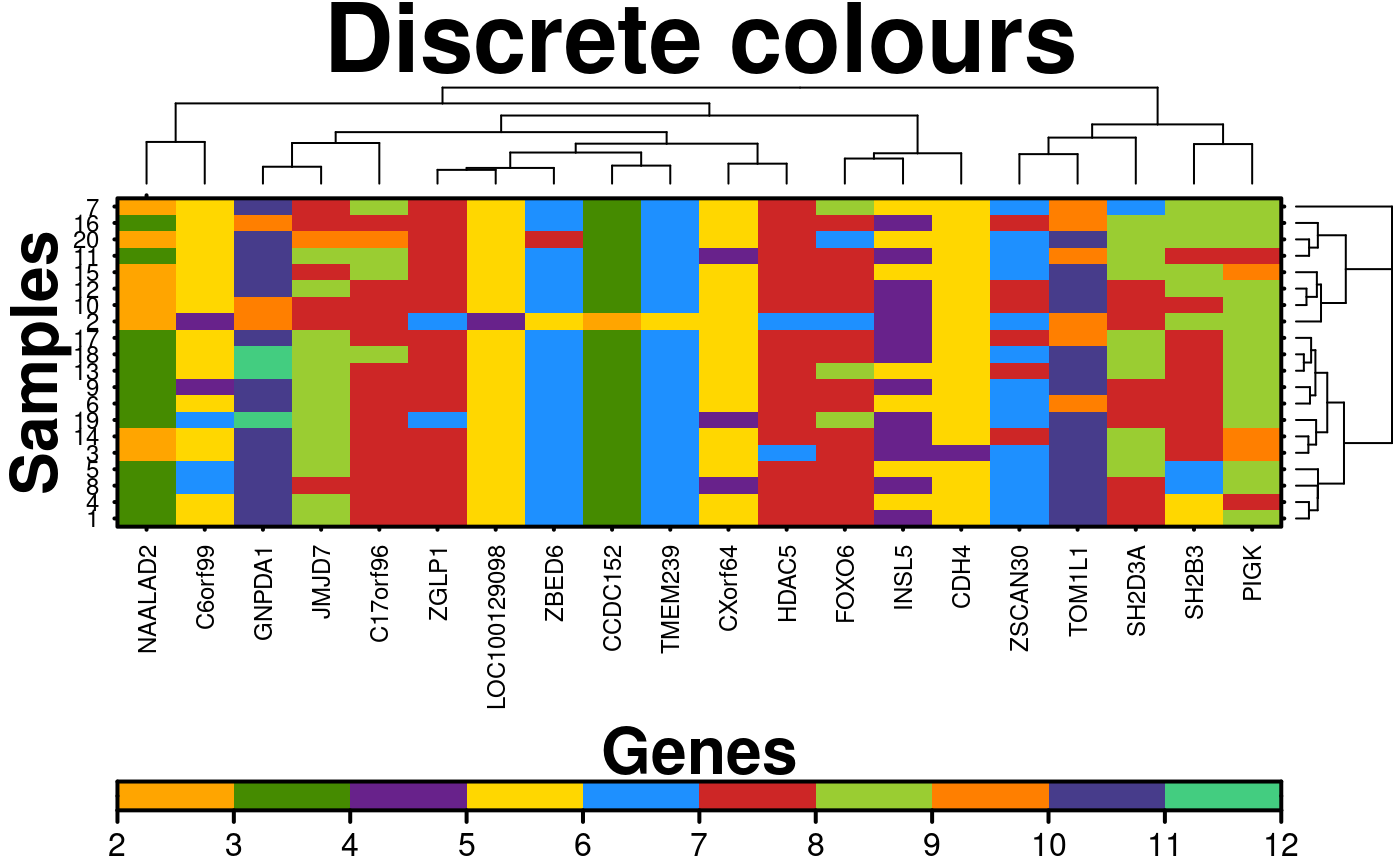
create.heatmap(
# filename = tempfile(pattern = 'Heatmap_Discrete_Colours_Qualitative', fileext = '.tiff'),
x = microarray[1:20, 1:20],
main = 'Discrete colours',
xlab.label = 'Genes',
ylab.label = 'Samples',
xaxis.lab = NA,
yaxis.lab = 1:20,
xaxis.cex = 0.75,
yaxis.cex = 0.75,
xaxis.fontface = 1,
yaxis.fontface = 1,
colourkey.cex = 1,
# Adjusting total colours plotted
colourkey.labels.at = seq(2,12,1),
colourkey.labels = seq(2,12,1),
at = seq(2,12,1),
# Add one to account for a 'null' colour
total.colours = 11,
colour.scheme = default.colours(10),
description = 'Heatmap created using BoutrosLab.plotting.general',
resolution = 200
);
#> Warning: Colour scheme may not be greyscale compatible.
 # Nature style
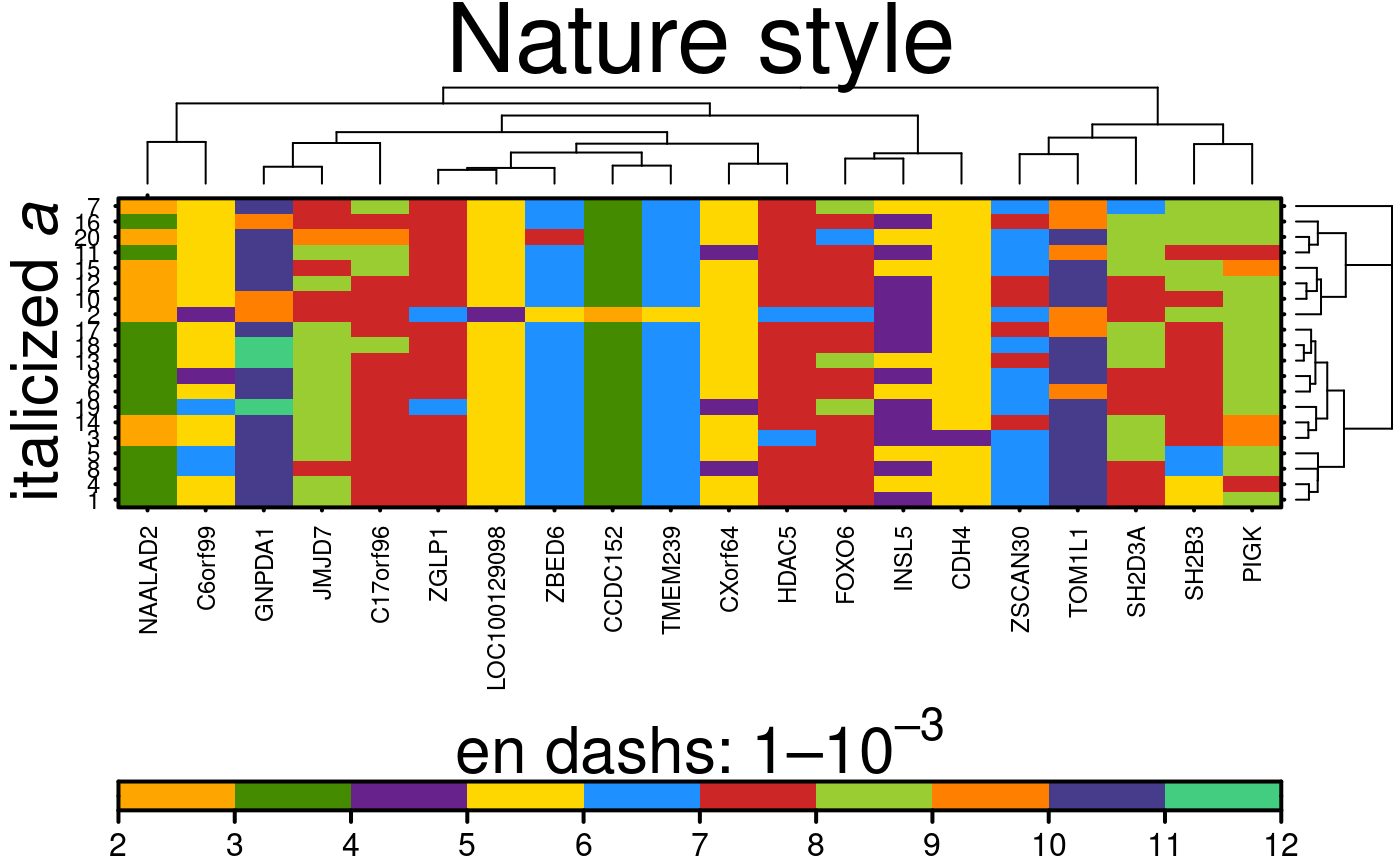
create.heatmap(
# filename = tempfile(pattern = 'Heatmap_Nature_style', fileext = '.tiff'),
x = microarray[1:20, 1:20],
main = 'Nature style',
xaxis.lab = NA,
yaxis.lab = 1:20,
xaxis.cex = 0.75,
yaxis.cex = 0.75,
xaxis.fontface = 1,
yaxis.fontface = 1,
colourkey.cex = 1,
# Adjusting total colours plotted
colourkey.labels.at = seq(2,12,1),
colourkey.labels = seq(2,12,1),
at = seq(2,12,1),
# Add one to account for a 'null' colour
total.colours = 11,
colour.scheme = default.colours(10),
# set style to Nature
style = 'Nature',
# demonstrating how to italicize character variables
ylab.label = expression(paste('italicized ', italic('a'))),
# demonstrating how to create en-dashes
xlab.label = expression(paste('en dashs: 1','\u2013', '10'^'\u2013', ''^3)),
description = 'Heatmap created using BoutrosLab.plotting.general',
resolution = 200
);
#> Warning: Colour scheme may not be greyscale compatible.
#> Warning: Setting resolution to 1200 dpi.
#> Warning: Nature also requires italicized single-letter variables and en-dashes
#> for ranges and negatives. See example in documentation for how to do this.
#> Warning: Avoid red-green colour schemes, create TIFF files, do not outline the figure or legend
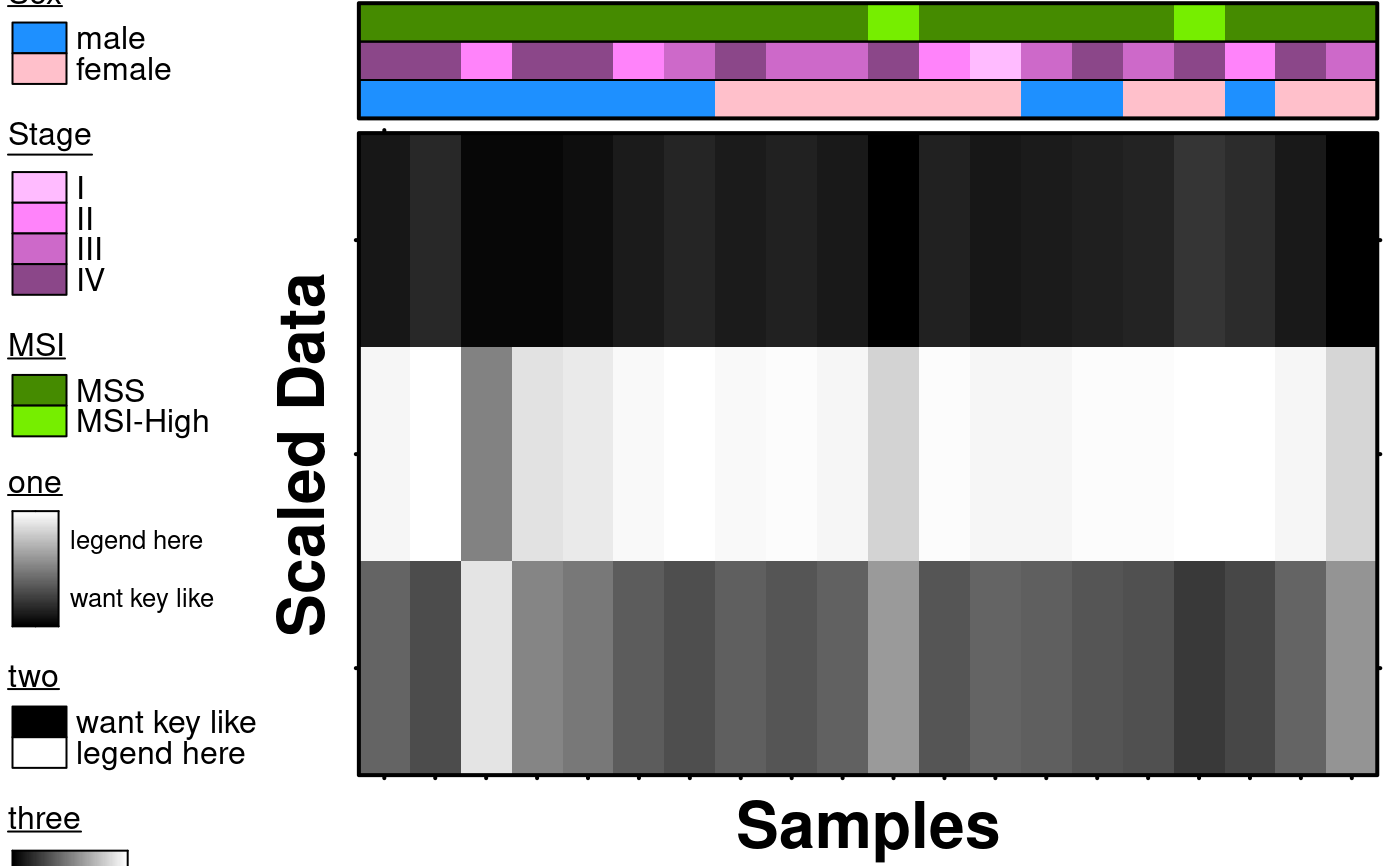
 # create heatmap with key like legend - used to show range of continuous variables
# First create legend with discrete colours
sex.colour <- as.character(patient$sex);
sex.colour[sex.colour == 'male'] <- 'dodgerblue';
sex.colour[sex.colour == 'female'] <- 'pink';
stage.colour <- as.character(patient$stage)
stage.colour[stage.colour == 'I'] <- 'plum1'
stage.colour[stage.colour == 'II'] <- 'orchid1'
stage.colour[stage.colour == 'III'] <- 'orchid3'
stage.colour[stage.colour == 'IV'] <- 'orchid4'
msi.colour <- as.character(patient$msi)
msi.colour[msi.colour == 'MSS'] <- 'chartreuse4'
msi.colour[msi.colour == 'MSI-High'] <- 'chartreuse2'
discrete.covariate <- list(
rect = list(
col = 'transparent',
fill = sex.colour,
lwd = 1.5
),
rect = list(
col = 'transparent',
fill = stage.colour,
lwd = 1.5
),
rect = list(
col = 'transparent',
fill = msi.colour,
lwd = 1.5
)
);
discrete.covariate.legend <- list(
legend = list(
colours = c('dodgerblue', 'pink'),
labels = c('male','female'),
title = expression(underline('Sex'))
),
legend = list(
colours = c('plum1', 'orchid1', 'orchid3', 'orchid4'),
labels = c('I','II', 'III', 'IV'),
title = expression(underline('Stage'))
),
legend = list(
colours = c('chartreuse4', 'chartreuse2'),
labels = c('MSS','MSI-High'),
title = expression(underline('MSI'))
),
legend = list(
colours = c('grey0', 'grey100'),
labels = c('want key like','legend here'),
title = expression(underline('one')),
continuous = TRUE,
height=3
),
legend = list(
colours = c('grey0', 'grey100'),
labels = c('want key like','legend here'),
title = expression(underline('two'))
),
legend = list(
colours = c('grey0', 'grey100'),
labels = c(0,10),
title = expression(underline('three')),
continuous = TRUE,
width = 3,
tck = 1,
tck.number = 3,
at = c(0,100),
angle = -90,
just = c("center","bottom")
)
);
create.heatmap(
# filename = tempfile(pattern = 'Heatmap_ContinuousVariablesKey', fileext = '.tiff'),
x = patient[1:20, 4:6],
xlab.label = 'Samples',
ylab.label = 'Scaled Data',
xaxis.cex = 0.75,
yaxis.cex = 0.75,
clustering.method = 'none',
print.colour.key = FALSE,
scale=TRUE,
same.as.matrix = FALSE,
covariates.top = discrete.covariate,
covariates.top.grid.row = list(lwd = 1),
covariate.legends = discrete.covariate.legend,
legend.title.just = 'left',
colour.scheme = c('gray0','grey100'),
fill.colour = 'grey95',
axis.xlab.padding = 1.5,
resolution = 200
);
#> Warning: 'x' is NULL so the result will be NULL
#> Warning: 'x' is NULL so the result will be NULL
#> Warning: 'x' is NULL so the result will be NULL
#> Warning: 'x' is NULL so the result will be NULL
 create.heatmap(
# filename = tempfile(pattern = 'Heatmap_borderRemoved', fileext = '.tiff'),
x = simple.data,
main = 'Simple',
description = 'Heatmap created using BoutrosLab.plotting.general',
axes.lwd = 0,
resolution = 200
);
 # }
# }