Make a histogram
create.histogram.RdTakes a vector and creates a histogram
Usage
create.histogram(
  x,
  data,
  filename = NULL,
  main = NULL,
  main.just = 'center',
  main.x = 0.5,
  main.y = 0.5,
  main.cex = 3,
  xlab.label = NULL,
  ylab.label = NULL,
  xlab.cex = 2,
  ylab.cex = 2,
  xlab.col = 'black',
  ylab.col = 'black',
  xaxis.lab = TRUE,
  yaxis.lab = TRUE,
  xaxis.cex = 1.5,
  yaxis.cex = 1.5,
  xlimits = NULL,
  ylimits = NULL,
  xat = TRUE,
  yat = TRUE,
  xaxis.rot = 0,
  yaxis.rot = 0,
  xaxis.col = 'black',
  yaxis.col = 'black',
  xaxis.tck = 1,
  yaxis.tck = 1,
  xaxis.fontface = 'bold',
  yaxis.fontface = 'bold',
  xlab.top.label = NULL,
  xlab.top.cex = 2,
  xlab.top.col = 'black',
  xlab.top.just = 'center',
  xlab.top.x = 0.5,
  xlab.top.y = 0,
  type = 'percent',
  breaks = NULL,
  col = 'white',
  border.col = 'black',
  lwd = 2,
  lty = 1,
  layout = NULL,
  x.spacing = 0,
  y.spacing = 0,
  x.relation = 'same',
  y.relation = 'same',
  strip.col = 'white',
  strip.cex = 1,
  top.padding = 0.1,
  bottom.padding = 0.7,
  right.padding = 0.1,
  left.padding = 0.5,
  ylab.axis.padding = 0,
  abline.h = NULL,
  abline.v = NULL,
  abline.col = 'black',
  abline.lwd = 1,
  abline.lty = 1,
  key = NULL,
  legend = NULL,
  add.text = FALSE,
  text.labels = NULL,
  text.x = NULL,
  text.y = NULL,
  text.col = 'black',
  text.cex = 1,
  text.fontface = 'bold',
  add.rectangle = FALSE,
  xleft.rectangle = NULL,
  ybottom.rectangle = NULL,
  xright.rectangle = NULL,
  ytop.rectangle = NULL,
  col.rectangle = 'transparent',
  alpha.rectangle = 1,
  height = 6,
  width = 6,
  size.units = 'in',
  resolution = 1600,
  enable.warnings = FALSE,
  description = 'Created with BoutrosLab.plotting.general',
  style = 'BoutrosLab',
  preload.default = 'custom',
        use.legacy.settings = FALSE,
  inside.legend.auto = FALSE
  );
Arguments
- x
A formula or a numeric vector (not frequencies!)
- data
An optional data source if x is a formula
- filename
Filename for tiff output, or if NULL returns the trellis object itself
- main
The main title for the plot (space is reclaimed if NULL)
- main.just
The justification of the main title for the plot, default is centered
- main.x
The x location of the main title, deault is 0.5
- main.y
The y location of the main title, default is 0.5
- main.cex
Size of text for main plot title, defaults to 2
- xlab.label
x-axis title
- ylab.label
y-axis title
- xlab.cex
Size of x-axis label, defaults to 2
- ylab.cex
Size of y-axis label, defaults to 2
- xlab.col
Colour of the x-axis label, defaults to “black”
- ylab.col
Colour of the y-axis label, defaults to “black”
- xaxis.lab
Vector listing x-axis tick labels, defaults to automatic
- yaxis.lab
Vector listing y-axis tick labels, defaults to automatic
- xaxis.cex
Size of x-axis tick labels, defaults to 1
- yaxis.cex
Size of y-axis tick labels, defaults to 1
- xlimits
Two-element vector giving the x-axis limits
- ylimits
Two-element vector giving the y-axis limits
- xat
Vector listing where the x-axis ticks should be drawn
- yat
Vector listing where the y-axis ticks should be drawn
- xaxis.rot
Rotation of x-axis tick labels; defaults to 0
- yaxis.rot
Rotation of y-axis tick labels; defaults to 0
- xaxis.col
Colour of the x-axis tick labels, defaults to “black”
- yaxis.col
Colour of the y-axis tick labels, defaults to “black”
- xaxis.tck
Specifies the length of the tick marks for x-axis, defaults to 1
- yaxis.tck
Specifies the length of the tick marks for y-axis, defaults to 1
- xaxis.fontface
Fontface for the x-axis scales
- yaxis.fontface
Fontface for the y-axis scales
- xlab.top.label
The label for the top x-axis
- xlab.top.cex
Size of top x-axis label
- xlab.top.col
Colour of the top x-axis label
- xlab.top.just
Justification of the top x-axis label, defaults to centered
- xlab.top.x
The x location of the top x-axis label
- xlab.top.y
The y location of the top y-axis label
- type
Should the plot be of the “percent” (default), “density” or “count”
- breaks
A vector listing the break-points of the histogram, or an integer specifying the desired number of breaks.
- col
Fill colour for the histograms
- border.col
Specify border colour (defaults to black)
- lwd
Specifies line width
- lty
Specifies line style
- layout
A vector specifying the number of columns, rows (e.g., c(2,1). Default is NULL; see lattice::xyplot for more details
.
- x.spacing
A number specifying the distance between panels along the x-axis, defaults to 0
- y.spacing
A number specifying the distance between panels along the y-axis, defaults to 0
- x.relation
Allows x-axis scales to vary if set to “free”, defaults to “same”
- y.relation
Allows y-axis scales to vary if set to “free”, defaults to “same”
- strip.col
Strip background colour, defaults to “white”
- strip.cex
Strip title character expansion
- top.padding
A number specifying the distance to the top margin, defaults to 0.1
- bottom.padding
A number specifying the distance to the bottom margin, defaults to 0.7
- right.padding
A number specifying the distance to the right margin, defaults to 0.5
- left.padding
A number specifying the distance to the left margin, defaults to 0.5
- ylab.axis.padding
A number specifying the distance of ylabel to the y-axis, defaults to 0
,
- abline.h
Allow horizontal line to be drawn, default to NULL
- abline.v
Allow vertical line to be drawn, default to NULL
- abline.col
Horizontal and vertical line colour, defaults to black
- abline.lwd
Specifies horizontal/vertical line width, defaults to 1
- abline.lty
Specifies horizontal/vertical line style, defaults to 1 (solid)
- key
Add a key to the plot. See xyplot.
- legend
Add a legend to the plot. Helpful for adding multiple keys and adding keys to the margins of the plot. See xyplot.
- add.text
Allow additional text to be drawn, default is FALSE
- text.labels
Labels for additional text
- text.x
The x co-ordinates where additional text should be placed
- text.y
The y co-ordinates where additional text should be placed
- text.col
The colour of additional text
- text.cex
The size of additional text
- text.fontface
The fontface for additional text
- add.rectangle
Allow a rectangle to be drawn, default is FALSE
- xleft.rectangle
Specifies the left x ooordinate of the rectangle to be drawn
- ybottom.rectangle
Specifies the bottom y coordinate of the rectangle to be drawn
- xright.rectangle
Specifies the right x coordinate of the rectangle to be drawn
- ytop.rectangle
Specifies the top y coordinate of the rectangle to be drawn
- col.rectangle
Specifies the colour to fill the rectangle's area
- alpha.rectangle
Specifies the colour bias of the rectangle to be drawn
- height
Figure height, defaults to 6 inches
- width
Figure width, defaults to 6 inches
- size.units
Figure units, defaults to inches
- resolution
Figure resolution in dpi, defaults to 1600
- enable.warnings
Print warnings if set to TRUE, defaults to FALSE
- description
Short description of image/plot; default NULL.
- style
defaults to “BoutrosLab”, also accepts “Nature”, which changes parameters according to Nature formatting requirements
- preload.default
ability to set multiple sets of diffrent defaults depending on publication needs
- use.legacy.settings
boolean to set wheter or not to use legacy mode settings (font)
- inside.legend.auto
boolean specifying whether or not to use the automatic inside legend function
Value
If filename is NULL then returns the trellis object, otherwise creates a plot and returns a 0/1 success code.
Warning
If this function is called without capturing the return value, or specifying a filename, it may crash while trying to draw the histogram. In particular, if a script that uses such a call of create histogram is called by reading the script in from the command line, it will fail badly, with an error message about unavailable fonts:
    Error in grid.Call.graphics("L_text", as.graphicsAnnot(x$label), x$x,  )
        Invalid font type
    Calls: print ... drawDetails.text -> grid.Call.graphics -> .Call.graphics
Examples
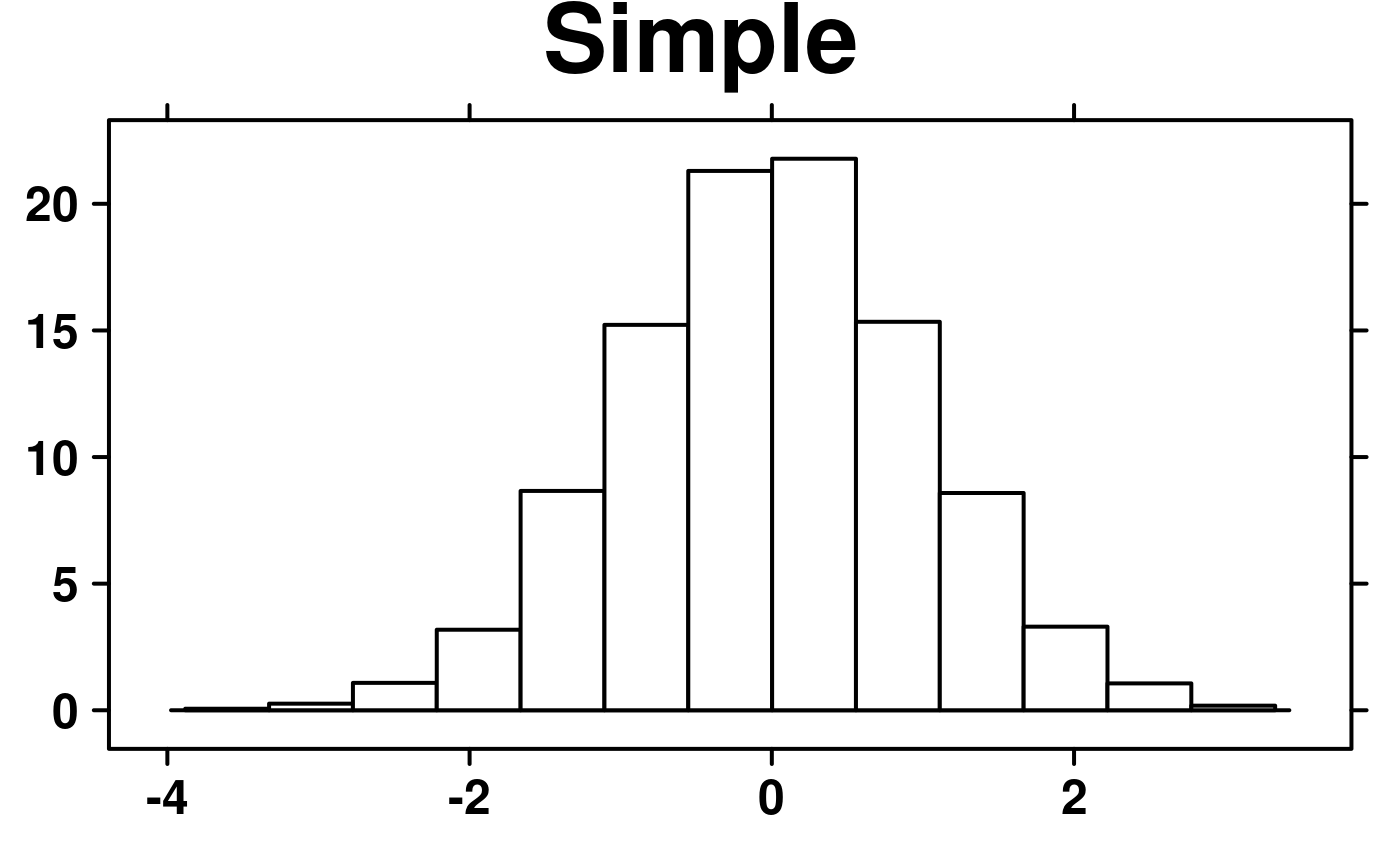
set.seed(12345);
create.histogram(
# filename = tempfile(pattern = 'Histogram_Simple', fileext = '.tiff'),
x = rnorm(5000),
main = 'Simple',
description = 'Histogram created by BoutrosLab.plotting.general',
resolution = 50
);
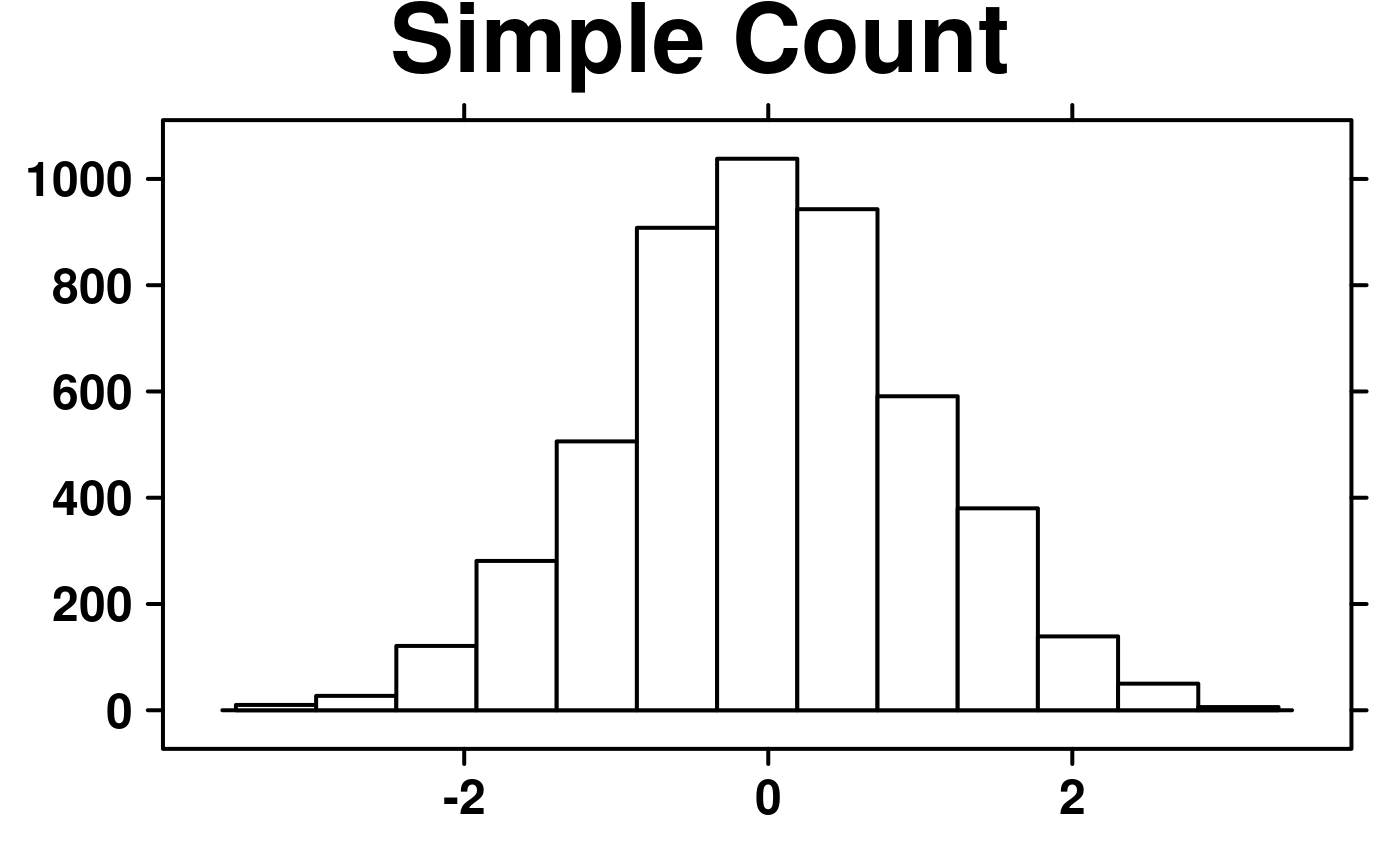
 create.histogram(
# filename = tempfile(pattern = 'Histogram_Simple_Count', fileext = '.tiff'),
x = rnorm(5000),
main = 'Simple Count',
description = 'Histogram created by BoutrosLab.plotting.general',
type = 'count',
resolution = 50
);
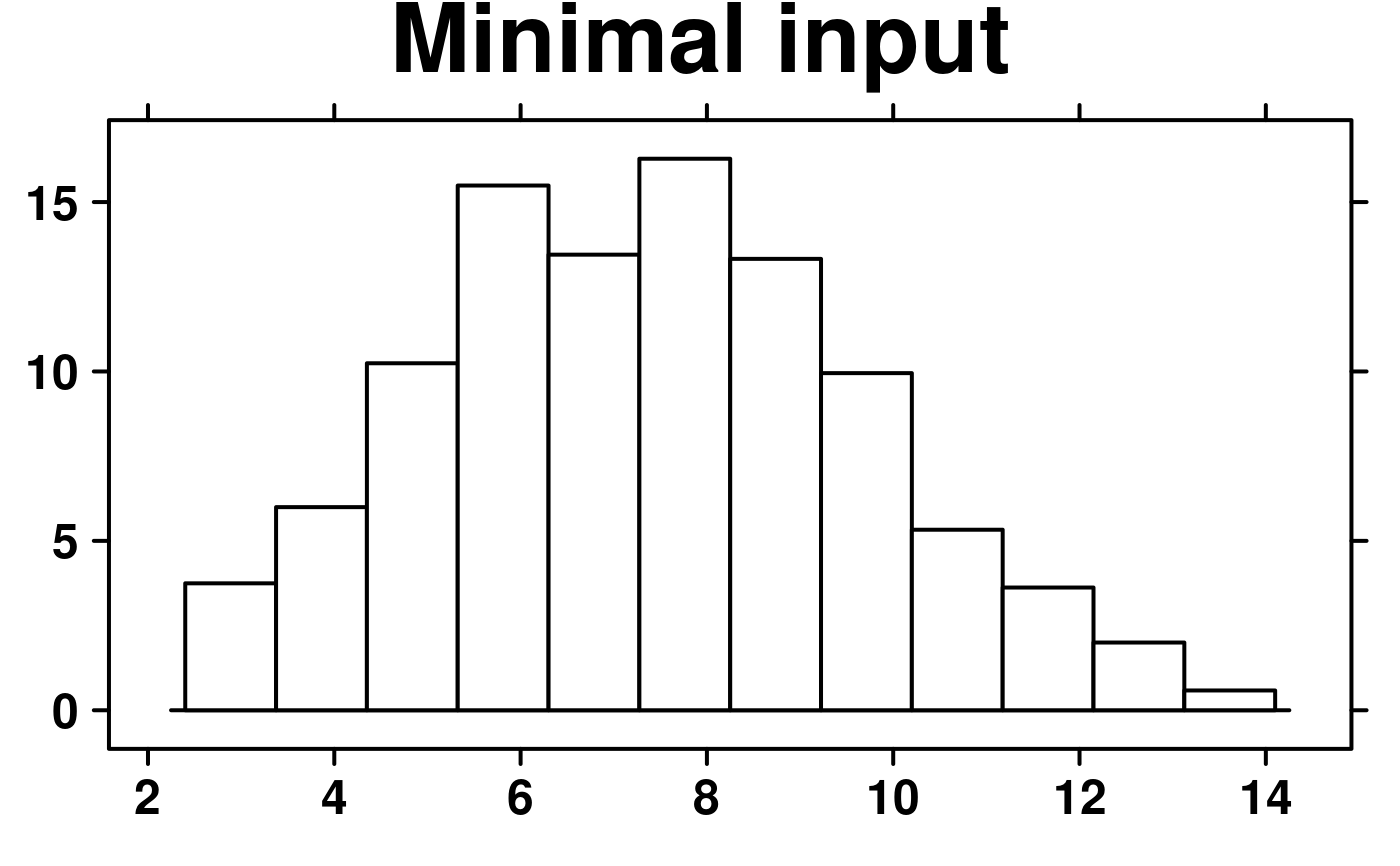
 # Minimal Input
create.histogram(
# filename = tempfile(pattern = 'Histogram_Minimal_Input', fileext = '.tiff'),
x = microarray[,1],
main = 'Minimal input',
description = 'Histogram created by BoutrosLab.plotting.general',
resolution = 50
);
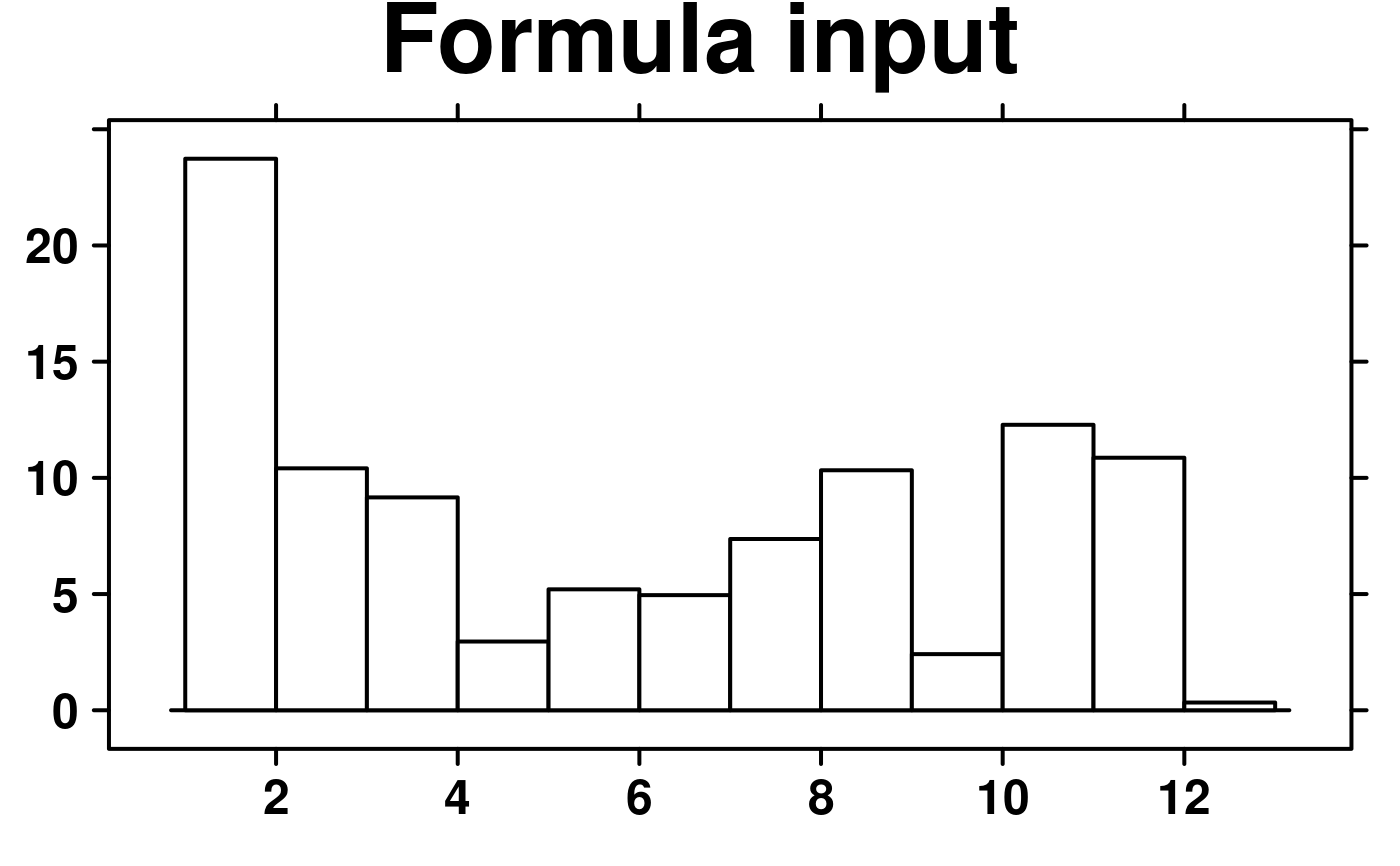
 # Formula Input - dividing by chromosome
chr.data <- data.frame(
x = microarray$Chr,
y = microarray[,1]
);
create.histogram(
# filename = tempfile(pattern = 'Histogram_Formula_Input', fileext = '.tiff'),
x = y ~ x,
data = chr.data,
main = 'Formula input',
description = 'Histogram created by BoutrosLab.plotting.general',
resolution = 100
);
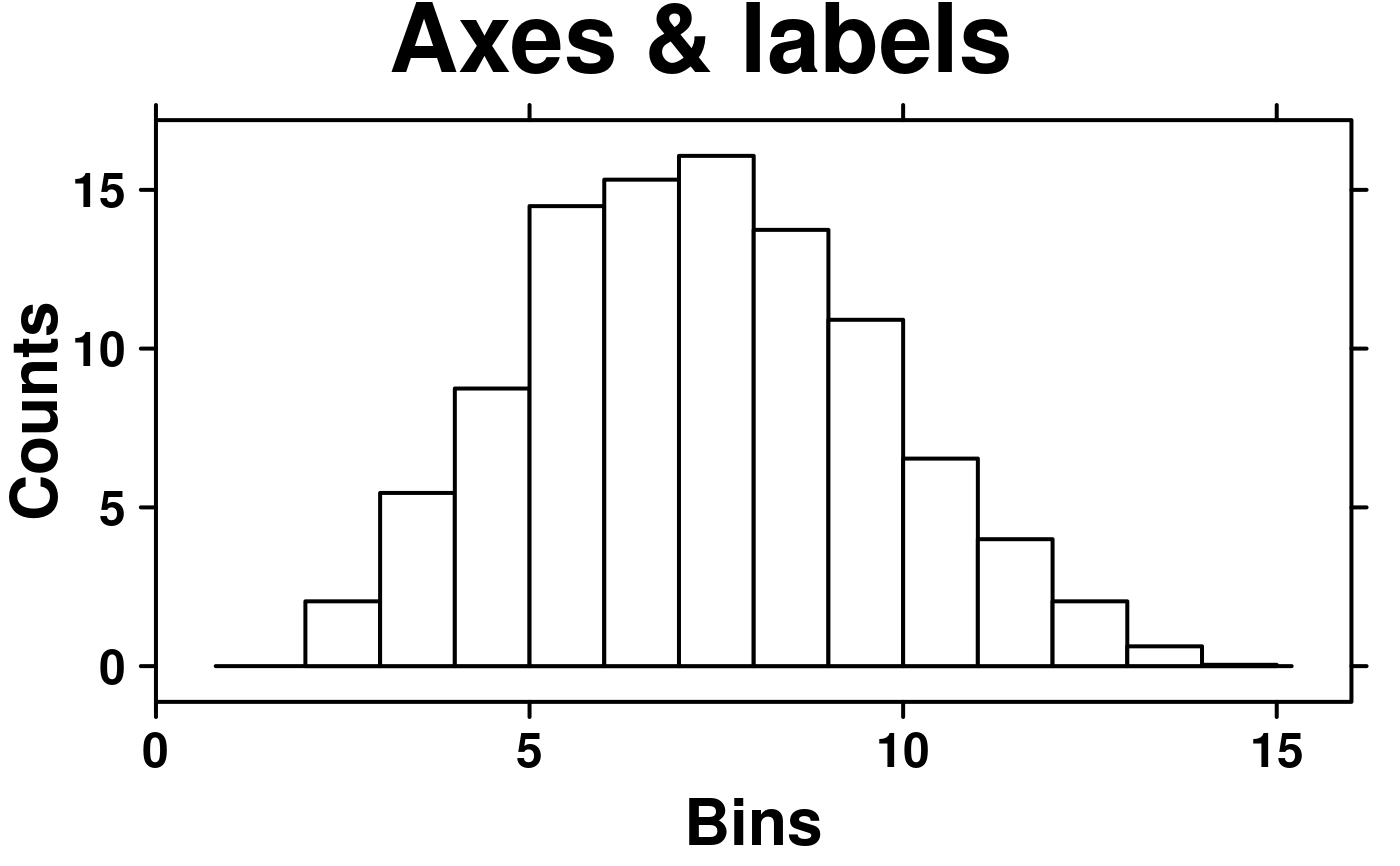
 # Axes and Labels
create.histogram(
# filename = tempfile(pattern = 'Histogram_Axes_Labels', fileext = '.tiff'),
x = microarray[,1],
main = 'Axes & labels',
# Customizing the axes and labels
xlab.label = 'Bins',
ylab.label = 'Counts',
xlimits = c(0, 16),
xat = seq(0,15,5),
# set break points for bins
breaks = seq(floor(min(microarray[,1])), ceiling(max(microarray[,1])), 1),
description = 'Histogram created by BoutrosLab.plotting.general',
resolution = 100
);
 # \donttest{
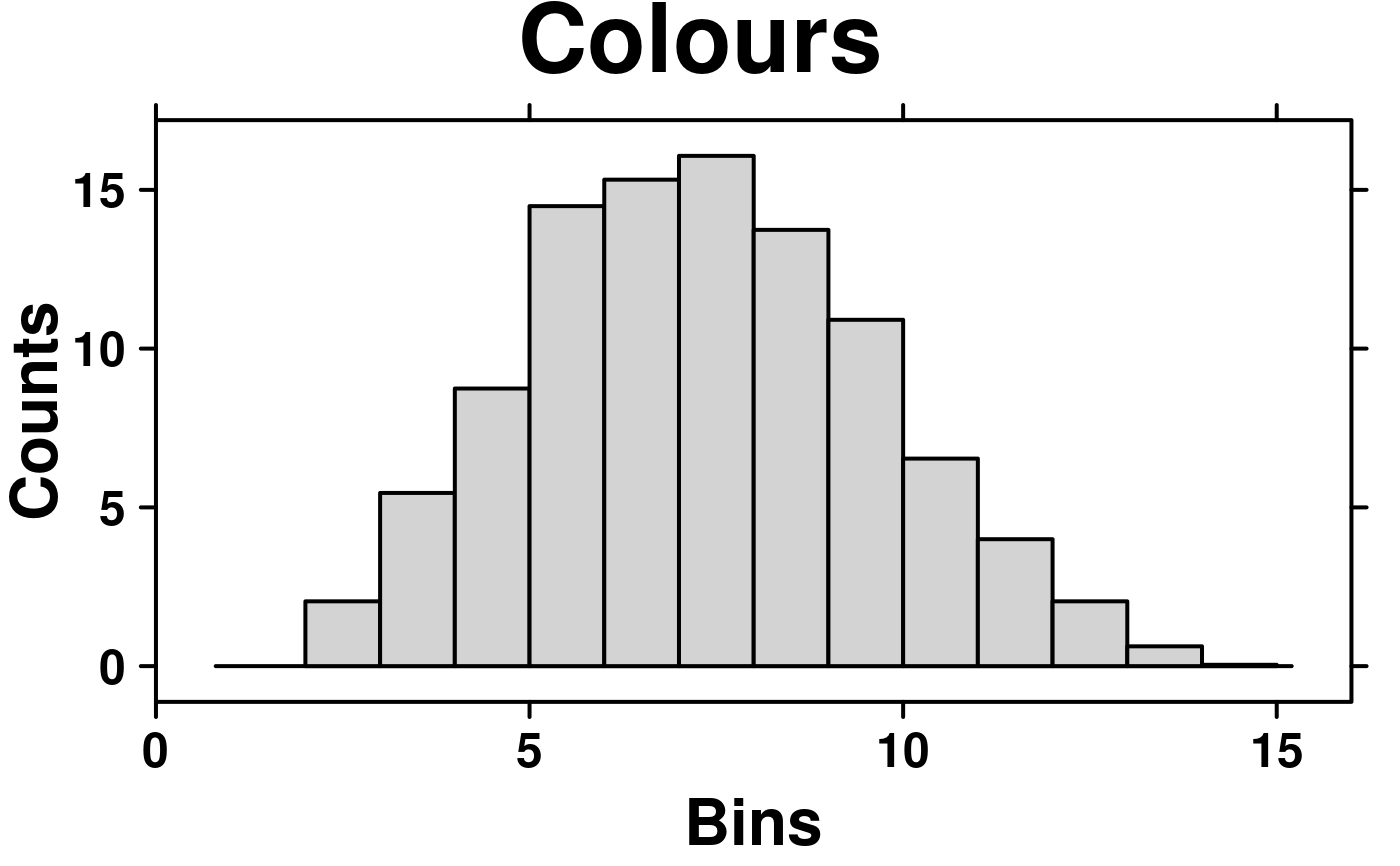
# Colour change
create.histogram(
# filename = tempfile(pattern = 'Histogram_Colours', fileext = '.tiff'),
x = microarray[,1],
main = 'Colours',
xlab.label = 'Bins',
ylab.label = 'Counts',
xlimits = c(0, 16),
xat = seq(0,15,5),
breaks = seq(floor(min(microarray[,1])), ceiling(max(microarray[,1])), 1),
# Colours
col = 'lightgrey',
description = 'Histogram created by BoutrosLab.plotting.general',
resolution = 100
);
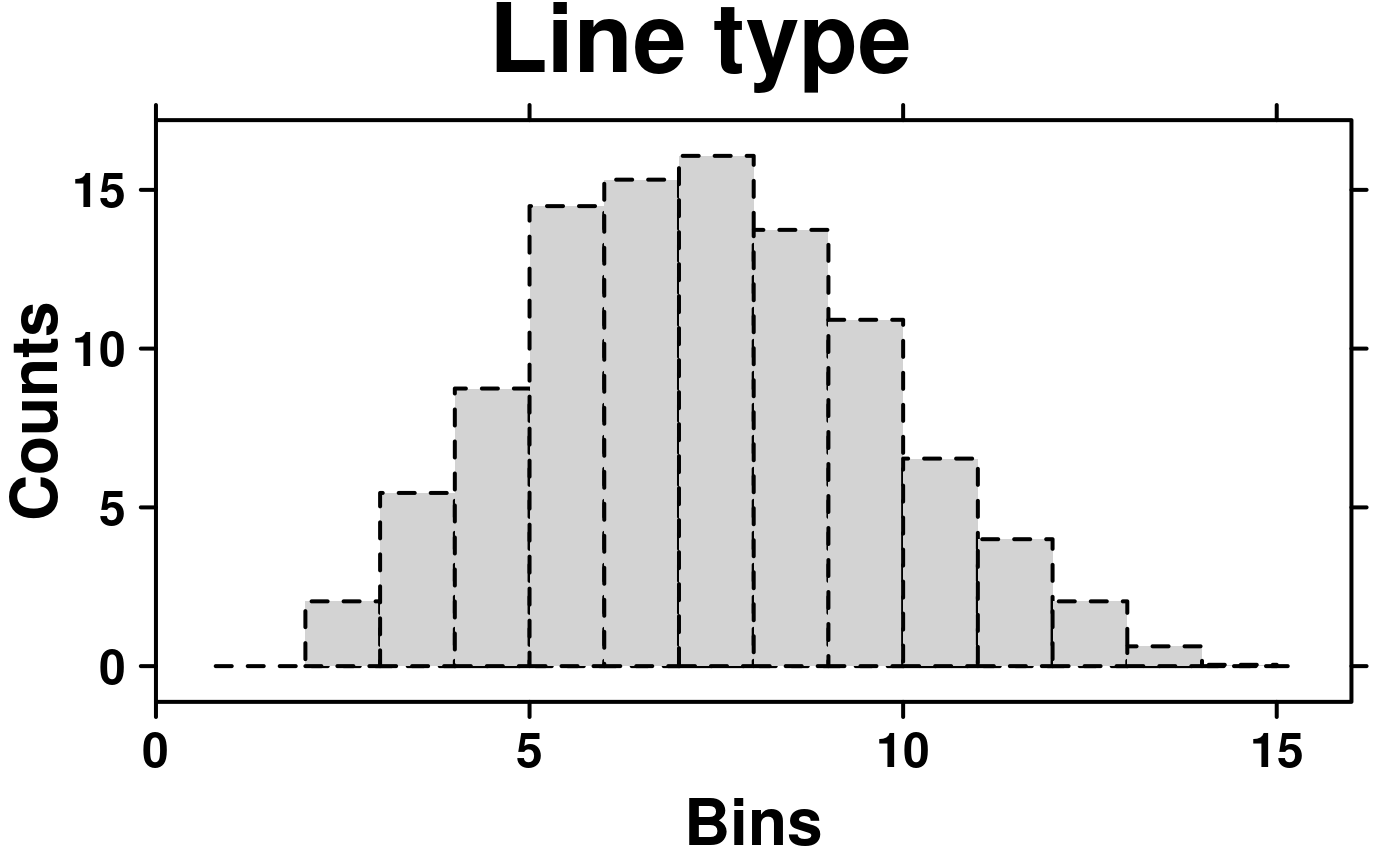
 # Line type
create.histogram(
# filename = tempfile(pattern = 'Histogram_Line_Type', fileext = '.tiff'),
x = microarray[,1],
main = 'Line type',
xlab.label = 'Bins',
ylab.label = 'Counts',
xlimits = c(0, 16),
xat = seq(0,15,5),
breaks = seq(floor(min(microarray[,1])), ceiling(max(microarray[,1])), 1),
col = 'lightgrey',
# Changing the line type
lty = 2,
description = 'Histogram created by BoutrosLab.plotting.general',
resolution = 200
);
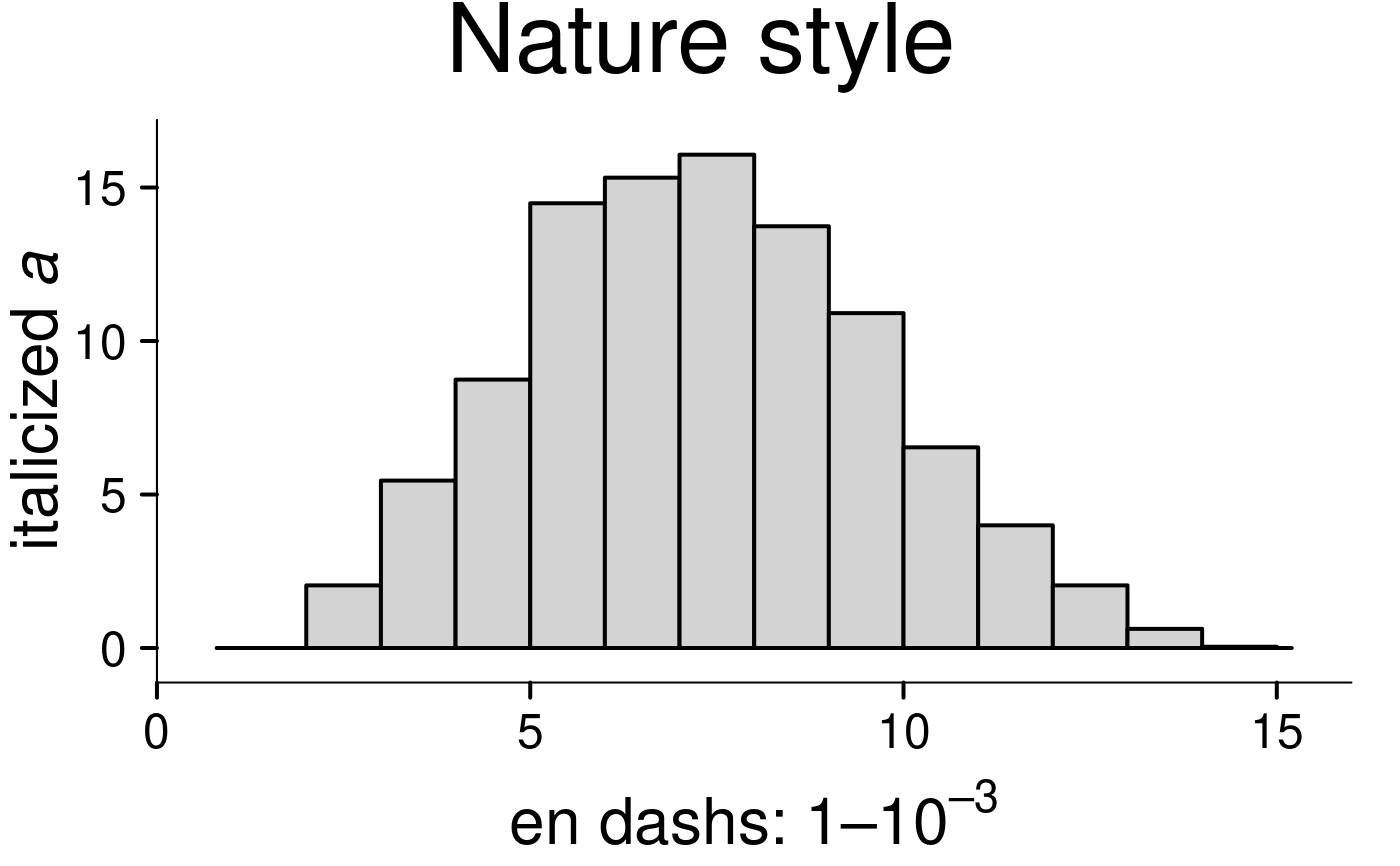
 # Nature style
create.histogram(
# filename = tempfile(pattern = 'Histogram_Nature_style', fileext = '.tiff'),
x = microarray[,1],
main = 'Nature style',
xlimits = c(0, 16),
xat = seq(0,15,5),
breaks = seq(floor(min(microarray[,1])), ceiling(max(microarray[,1])), 1),
col = 'lightgrey',
# set style to Nature
style = 'Nature',
# demonstrating how to italicize character variables
ylab.label = expression(paste('italicized ', italic('a'))),
# demonstrating how to create en-dashes
xlab.label = expression(paste('en dashs: 1','\u2013', '10'^'\u2013', ''^3)),
description = 'Histogram created by BoutrosLab.plotting.general',
resolution = 200
);
 # }
# }